PlusTM and
PM™
Units
1.
Introduction
Liquid Crystal Display
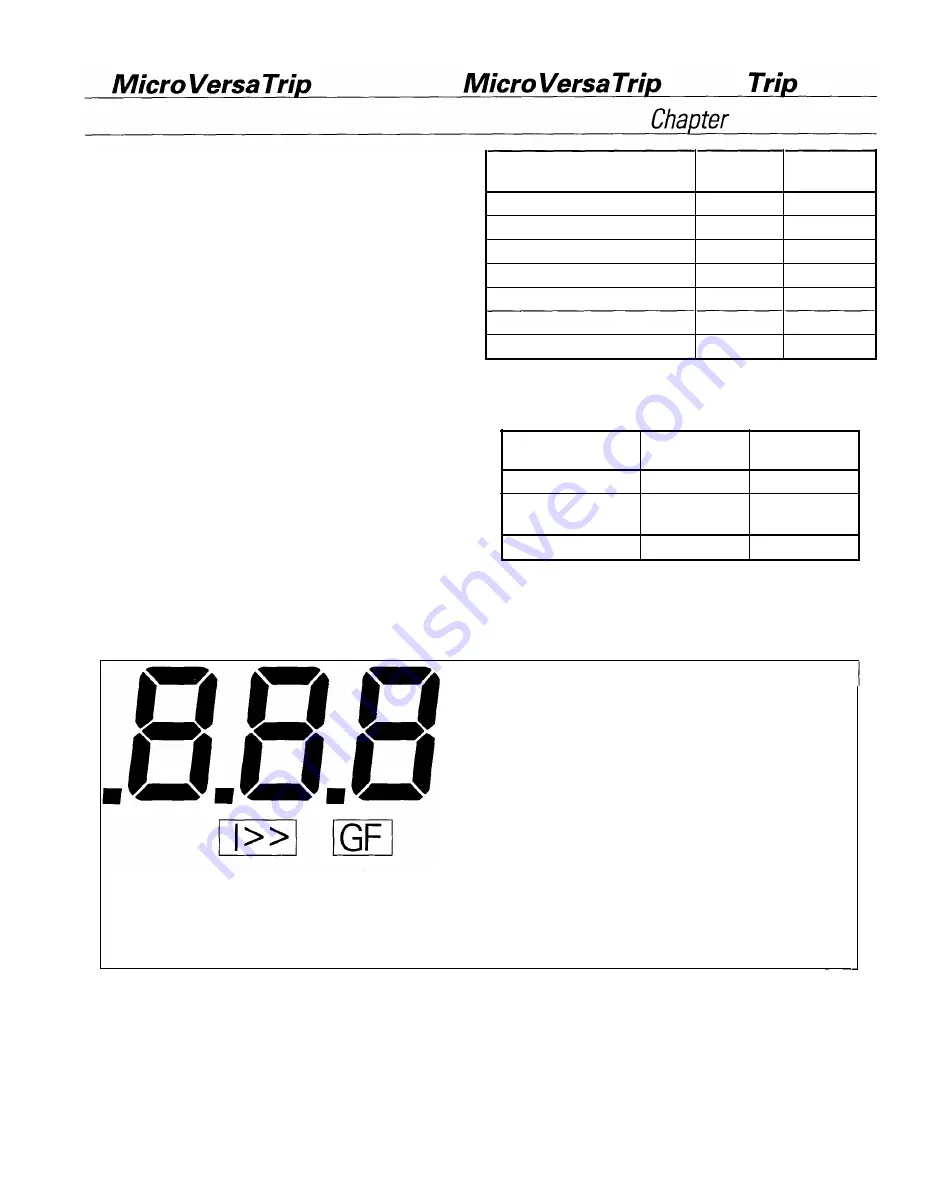
Figure 7 illustrates the LCD with all segments illumi
nated. The various segments are energized in
response to conditions sensed by the Trip Unit.
1-8
MicroVersaTrip Plus and
Micro Versa Trip PM Accuracies
The accuracy data in Table 7 represent the average
expected performance of MicroVersaTrip Plus and
MicroVersaTrip PM Trip Units. These data are valid
for setup, metering, and status mode displays. These
data include the effects of Trip Unit ambient
temperature variation from 0° C to 70° C.
All percentages are based on full-scale values. Full
scale current is
xln,
the rating of the breaker's rating
plug. Full-scale voltage is the potential transformer
primary voltage rating. These data do not include
the accuracy rating of any measuring instrument.
Refer to the trip-time curves listed in Table 8 for
characteristics and accuracies of overcurrent protec
tion.
Full-Scale
Value
Accuracy Resolution
Current (A,
kA)
±2%
± 0.5 digit
Voltage (V)
± 1 .5%
± 0.5 digit
Energy (kWh,
MWh,
GWh)
±3.5%
± 0.5 digit
Real power (kW,
MW)
±3.5%
± 0.5 digit
Total power (kVA, MVA)
±3.5%
±0.5 digit
Frequency (Hz)
±1 Hz
±1 Hz
Time delay (sec)
± 1 sec
± 1 sec
Table
7.
Protective relay and metering accuracies and
resolutions.
Trip-Time
Ground-
Breaker
Typ
e
Curves
Fault Curves
AKR
GES-9910
GES-991 1
Power Break®
GES-9909
GES-991 1
and R-Frame
Power Break® II
GES-9989
GES-9990
Table
8.
Trip-time curves for breaker types covered in this
guide.
VOLTS
01 C/f2 (/13
N SETUP
AMPS k A S
Hz
STATUS
kVA MVA
kW MW
METER
kWh MWh G/Vh xCT
xln
xiT
�
12T
K
ADDRESS
I
i
LT ST INST GF OPS OK DEM AND UVR I)!
11V 111 V< V> Pi Ph-Ph
Ph-N FAULT
D C2J -{[]}- rB
COS
0
PICKUP
DELAY
Figure
7.
Liquid crystal display segments.
9
www
. ElectricalPartManuals
. com


