GE
D
IRECTION
FQ091019, R
EVISION
2
V
IVID Q
N S
ERVICE
M
ANUAL
Chapter 7 - Diagnostics/Troubleshooting
7-53
As the testing sequence progresses, the progress bar will advance to reflect the test progress.
Status indicators in the Data Flow map corresponding to the various system components will be
highlighted in the appropriate color to indicate the current test status, as follows:
•
Green:
All recommended tests for these components have been completed and no problems
were identified.
•
Red:
Problems were identified in these components during the performance of the test.
•
Yellow:
The tests executed so far on these components have passed, but not all
recommended tests have been performed.
6.) At any stage, trackball to the
Pause
button and press
Set
, if required.
7.) To resume testing (from the point where you paused), trackball to the
Start
button and press
Set
.
When the ADC Test sequence is complete:
-
the
Diagnostic
Test
window displays the Finished message
-
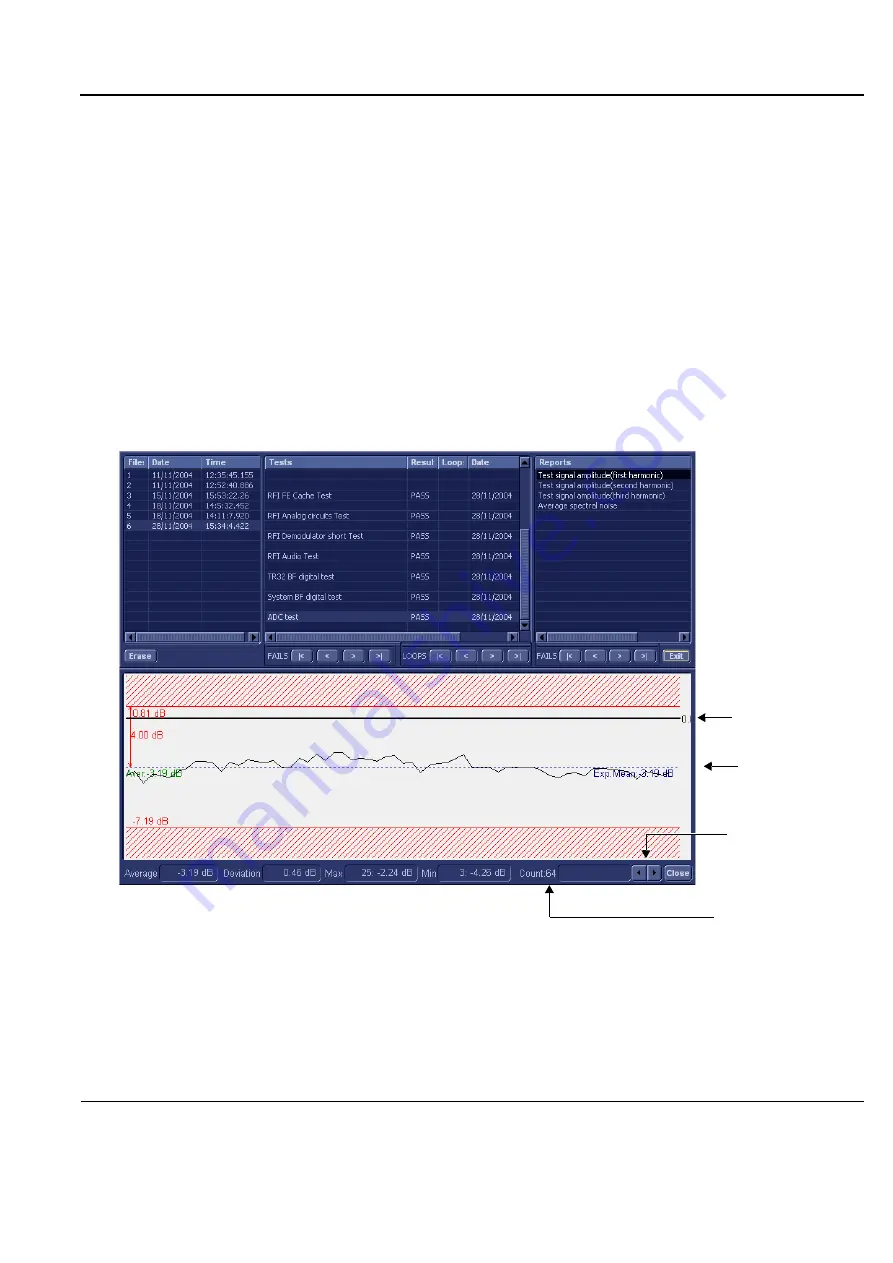
the View Test Log window opens automatically, listing all tests performed and showing details
of which tests passed or failed, as shown in the example in
.
NOTE:
The ADC test has four test reports which are listed in Reports on the right. By default, the First
Harmonic report is displayed in the Reports window below (
).
NOTE:
Left and right arrows provided in the View Report window enable scrolling between the different
channels. Left-clicking on a currently-selected channel marks a red square on the report graph,
and also evokes the display of the following information relative to that specific point: Average,
Deviation (standard deviation from the Average), Max, and Min.
Figure 7-28 View Test Log - First Harmonic Report
Scroll between
channels here
Average Result
Expected Average
Selected channel
Selected channel # (64)


