50
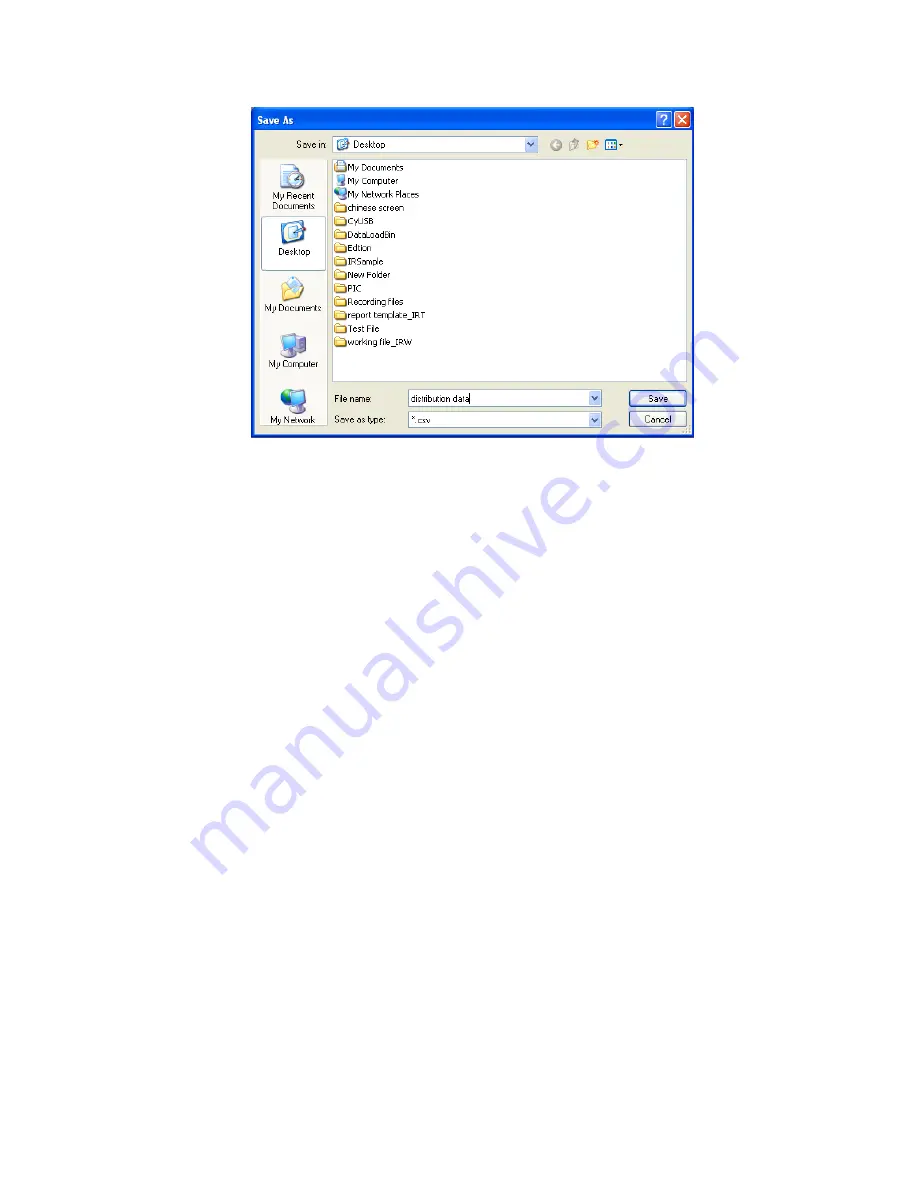
For recording file or real time monitor, users also can export trend data. You can right click on Trend
chart and select Start Export Data to begin data export. And right click on the Trend chart and select
Stop Export Data to end of data export. When stop data export, you can specify a file name to store
exported data. The export data is saved in the csv/ xls format that can be opened by text edit tool or
Microsoft Excel. Data Export generates a file that includes maximum temperature trend and minimum
temperature trend.
(3)
Copy
Copy the current image analysis chart into system’s clipboard so you can paste the distribution chart
into other application such as Word document.
(4)
Delete
Delete the current analysis chart.
(5)
Settings(for PRO, USB, NET, or ALL version)
Do a series of settings of analysis chart: style, 3D, graphics symbol and label.
Style settings: there are eight kinds of analysis chart style together.
Select Fast Line style:


