21
PC Analysis Program Use
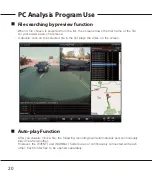
Positioning on the map
- With the GPS data, the map shows the location of the
vehicle while playing the recorded data.
- The Google map is viewable only whilst your PC is
connected to the Internet .
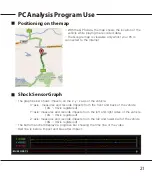
Shock Sensor Graph
- The graph below shows impacts on the x-y-z axis of the vehicle.
X-axis : measures and records impacts from the front and back of the vehicle
( 0G ~ 3G is registered)
Y-axis: measures and records impacts from the left and right sides of the vehicle
( 0G ~ 3G is registered)
Z-axis: measures and records impacts from the top and lower part of the vehicle
( 0G ~ 3G is registered)
- The bottom and left displays a progress bar showing the time line of the video.
- Red line is before impact and blue after impact.


