13
instrument reading in the horizontal dipole mode is more sensitive to instrument height or
conversely that in regions where the surface topography varies rapidly on the order of 10-20 cm
we can expect some scatter in the horizontal dipole readings.
In the event that the earth is two-layered it is possible to resolve this geometry by lifting the
EM38 above the ground and making a sequence of measurements at various heights in both the
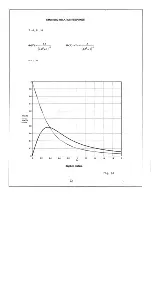
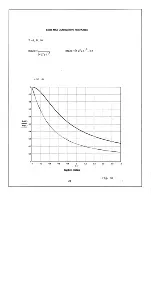
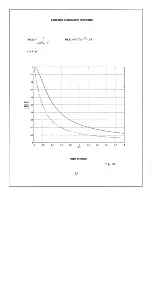
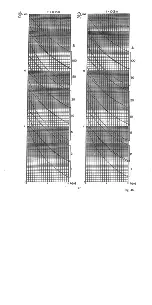
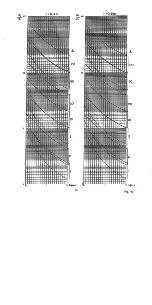
horizontal and vertical dipole mode. The curves shown in Figs. 4 and 5 illustrate the fall-off
with height of the apparent conductivity for a variety of two-layered configurations; to employ
them one simply plots the measured apparent conductivity with height on a piece of transparent
paper to the same scale as the figures and translates the plot vertically or horizontally across the
various figures until a match is obtained. The various layer parameters are then calculated as in
the following example, using the measured values of apparent conductivity from Table 1.
TABLE 1
Apparent Conductivity (mS/m)
h (m)
Vertical
Horizontal
Dipole
Dipole
0.0
93
77
0.5
62
36
1.0
41
23
1.5
29
16
2.0
23
12
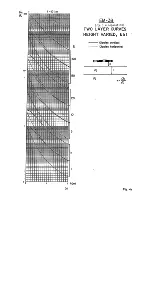
By translating this data as described above on top of the various curves of Fig. 4 we see that
good agreement is achieved for t=0.3 m and k=
2
/
1
=2. Furthermore we note that, in the vertical
dipole mode
a
/
1
=1.85 when
a
=93 mS/m. Therefore
1
=
a
/1.85=50 mS/m,
2
=2
1
=100
mS/m, and t=0.3 m, fully resolving the two-layered geometry.
It should be noted that these curves are also useful for a three-layered earth geometry where the
upper layer is relatively resistive compared with the other two, as illustrated in Fig. 6. In this
case we simply assume that
1
=0 and that this layer effectively prevents us from laying the
instrument on the more conductive second layer. The fall-off with height of the apparent
conductivity over such a geometry will still be as shown in Figs. 4 and 5 except that when a good
match to one of these curves has been obtained it will be found that at a measured instrument
height of zero meters the appropriate curve will still indicate a finite height, the value of which is
the actual thickness of the upper resistive layer.
The user is cautioned that, to the accuracy with which the measurements can be made, more than
one set of the curves shown in Figs. 4 and 5 may match the field data, in which case he must rely
on other factors (such as knowledge of the probable geology) to decide which model is more
appropriate.
Summary of Contents for EM38-MK2
Page 7: ...5 Fig A...
Page 23: ......
Page 24: ......
Page 25: ......
Page 26: ......
Page 27: ......
Page 28: ......
Page 29: ......
Page 30: ......
Page 31: ......
Page 32: ......
Page 33: ......
Page 34: ......
Page 35: ......
Page 36: ...34...
Page 37: ...35...
Page 38: ...36...
Page 39: ...37...
Page 44: ...42...


