


Instructions for Use
CPET
page 40
Version: 4 | Release date: 01 April 2022
3.1.4
Analysis
3.1.4.1
Presentation of Results
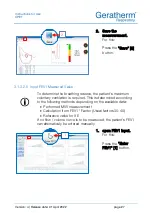
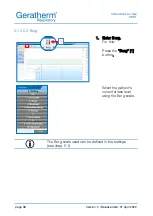
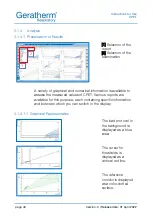
[1] Selection of the
report
[2] Selection of the
examination
A variety of graphical and numerical information is available to
assess the measured values of CPET. Various reports are
available for this purpose, each containing specific information
and between which you can switch in the display.
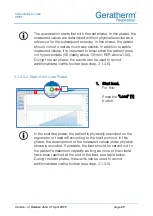
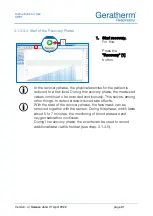
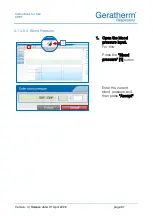
3.1.4.1.1
Graphical Representation
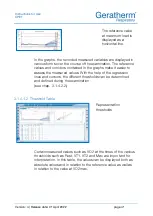
The load protocol in
the background is
displayed as a blue
area.
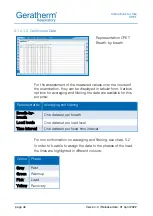
The cursor for
thresholds is
displayed as a
vertical red line.
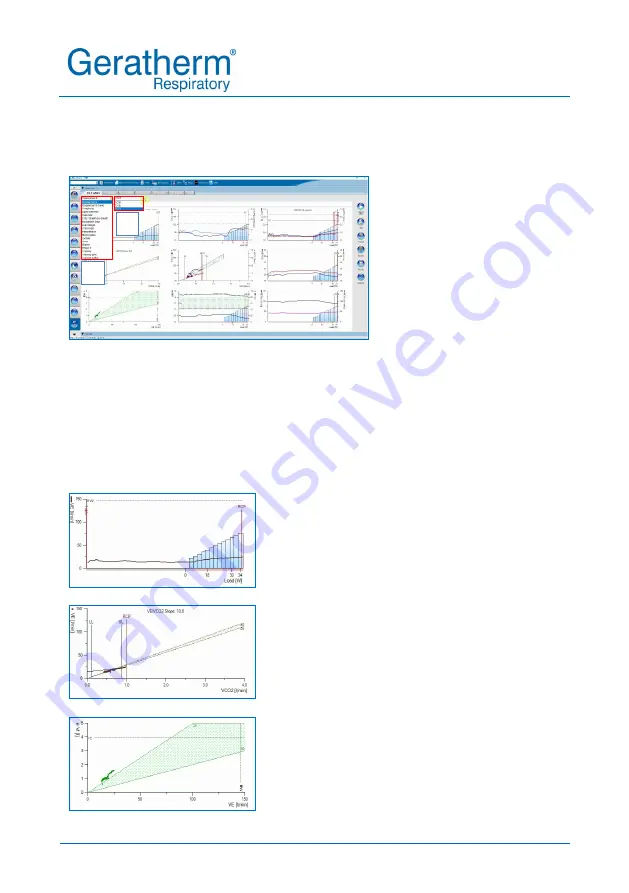
The reference
corridor is displayed
as a color-dotted
surface.
1
2


