


Instructions for Use
CPET
page 42
Version: 4 | Release date: 01 April 2022
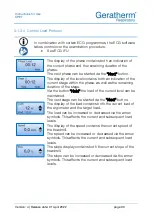
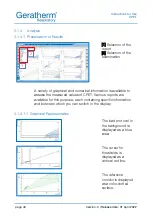
3.1.4.1.3
Continuous Data
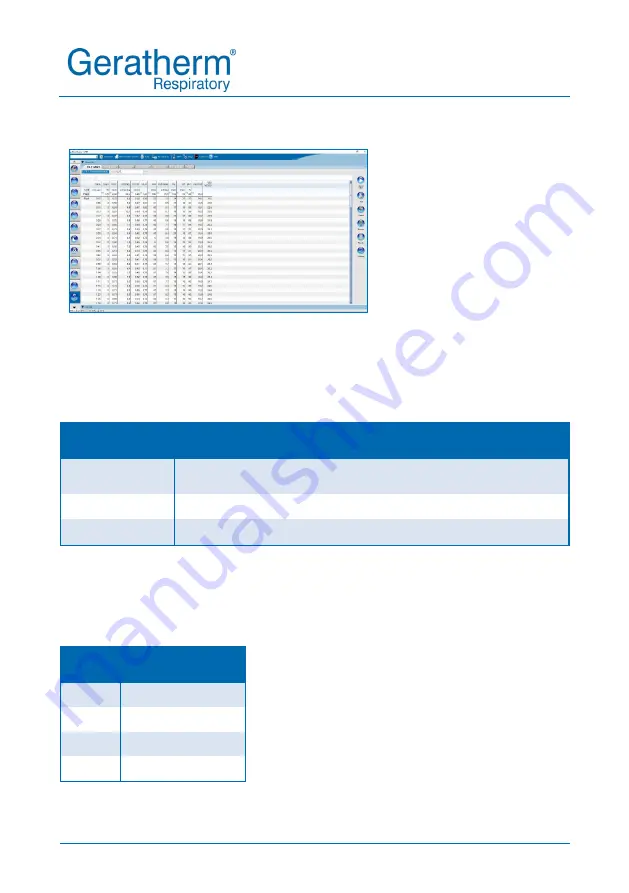
Representation CPET
Breath-by-breath
For the assessment of the measured values over the course of
the examination, they can be displayed in tabular form. Various
options for averaging and filtering the data are available for this
purpose:
Representation
Averaging and filtering
Breath-by-
breath
One data set per breath
Load levels
One data set per load level
Time interval
One data set per fixed time interval
For more information on averaging and filtering, see chap. 5.2
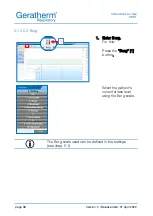
In order to be able to assign the data to the phases of the load,
the lines are highlighted in different colours:
Colour
Phase
Grey
Rest
Green Warmup
Pink
Load
Yellow Recovery


