Instructions for Use
CPET
Version: 4 | Release date: 01 April 2022
page 43
3.1.4.1.4
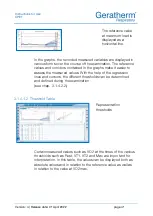
Tidal Loops
Representation of
tidal loops
[1] Resting-
flow/volume loop
[2] Tidal loops
[3] Selection of
edited tidal loop
[4] Cursor for ERV
correction
[5] Cursor for IRV
correction
[6] Table with
measured values
of the tidal loops
[7] Table with
measured values
of the resting
flow / volume loop
In this diagram, the tidal loops recorded under load are shown in
relation to each other and in relation to the resting flow / volume
loop. This allows the assessment of dynamic hyper-inflation as
well as flow limitations.
The area of the tidal loops that touches or exceeds the resting-
flow / volume loop and is thus presumably flow-limited is shown
in red.
In the table, the measured values of the individual tidal loops and
the resting-flow/volume loop are shown in order to be able to
evaluate them on the basis of the numerical results.
1
2
7
3
6
5
4
5
4
2

