HD2010UC
- 22 -
V4.2
Percentile Levels Graph
The graphic display is available for the sound level distribution of probabilities and also for
the percentile levels (“Advanced Data Logger” required).
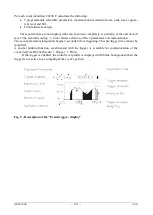
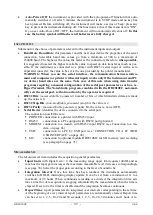
Fig. 7 - Description of the percentile level display
The figure shows the percentile levels graph corresponding to the distribution of probabilities
shown in the above paragraph.
From the sound level distribution of probabilities you can calculate the
cumulative distribu-
tion of probabilities
on the same classes. The cumulative distribution is equal to 100% for the clas-
ses with levels under the measured minimum, and 0% for the classes with levels over the measured
maximum. From the minimum measured level class, the cumulative distribution decreases for the
relevant probability of each class until the class corresponding to the maximum measured level,
where it becomes zero. The L
1
– L
99
percentile levels are calculated interpolating the cumulative
distribution of probabilities.
The vertical axis shows the sound levels in decibels and the percentile index is on the horizon-
tal axis. The display shows the sampling interval in the left lower corner and the chosen measure-
ment parameter for the statistical analysis in the first line, left of the status indicator and the possible
overload indicator.
The amplitude of the vertical scale corresponds to 5 divisions. The amplitude of each division
is called “scale factor” of the graph and appears in the middle of the vertical axis. This parameter is
selectable in real time among 20dB, 10dB or 5dB by division. The scale factor can be set using the
RIGHT (zoom +) and LEFT (zoom -) keys.
Use the UP and DOWN arrows to set the graph full scale with steps equal to the selected scale fac-
tor. In this way, the graph can be shifted UP or DOWN according to the pressed key.
An “analogue” bar indicator on the display right side provides the non-weighted instantaneous
level of the input sound pressure level, as for the SLM mode bar.
The parameter chosen for statistical analysis can be changed without accessing the menus, but
simply using the SELECT keys, the four arrows (UP, DOWN, LEFT and RIGHT) and ENTER (for
more details, see "Selecting Parameters " on page 15).
Using the Cursors
The CURSOR, LEFT and RIGHT keys on the keypad enable and move the cursor.
The second line at the top of the display shows the percentile level indicated by the cursor.
Press CURSOR again to disable the cursor.
Summary of Contents for DeltaOHM HD2010UC
Page 2: ...HD2010UC 2 V4 2 ...
Page 129: ...HD2010UC 129 V4 2 NOTES ...
Page 130: ...HD2010UC 130 V4 2 NOTES ...
Page 131: ......


