Gill Instruments Limited
_____________________________________________________________________________________________________________
________________________________________________________________________________________________
MetStream 105
Page 35
Issue 1
Doc. No. 1955-PS-001
April 2014
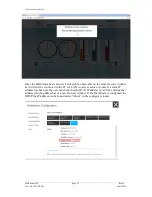
Where applicable at the bottom of the MetStream parameter display there are 2 tool signs.
Trend Graphs
Click on the Trend Graph icon to open a trend graph of the parameter of
interest.
E.g. Wind Direction.
Select a trend period value as required.
Trend Graph Period Sampling.
One Minute screen
- a reading is taken every second.
One Hour Screen
- a reading is taken once every minute.
24 hours screen
- a reading is taken once every 30 minutes.
7 days
- a reading is taken once every 3 hours (00:00, 03:00, 06:00 etc.).
28 days
- a reading is taken once every 3 hours (00:00, 03:00, 06:00 etc.).
Trend plots are built from the logged data stored in the MetStream. On power up, it may
take several minutes for all of the plots to be populated from the stored data.

