Global Specialties
Using the Software
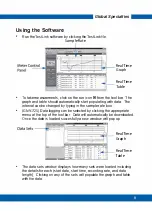
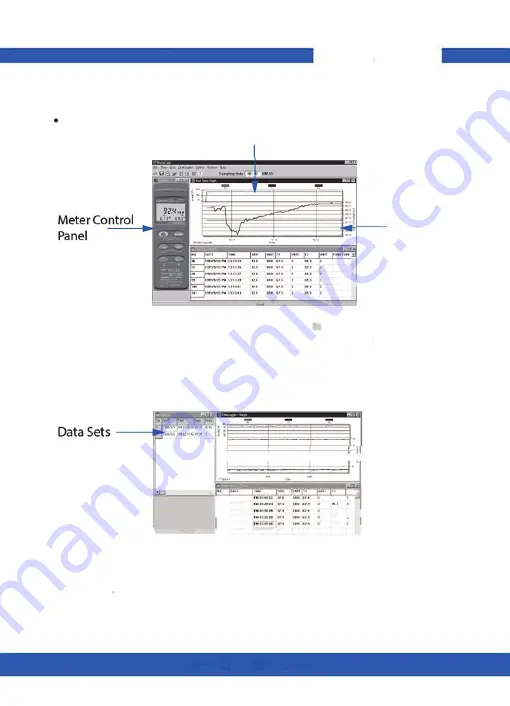
Run the Testlink software by clicking the Testlink file.
Sample Rate
RealTime
Graph
RealTime
--
f--
-
Table
•
To take measurements, click on the run icon III from the tool bar. The
graph and table should automatically start populating with data. The
interval can be changed by typing in the sample rate box.
•
(GNV-725) Data logging can be selected by clicking the appropriate
menu at the top of the tool bar. Data will automatically be downloaded.
Once the data is loaded succesfully a new window will pop up.
Real Time
1----!----1--
-
rtt-
-
Graph
"'H::::
·•
.•.
,
RealTime
I!=!
:
-
:
...
,
-
f---
d
,
;:;
•.
Table
'---g:-::.......::·:.::.:.:...::.:....::��.,
...:.......J
•
T he data sets window displays how many sets were loaded including
the details for each (start date, start time, recording rate, and data
length) Clicking on any of the sets will populate the graph and table
with the data.
8

