Page 15
13
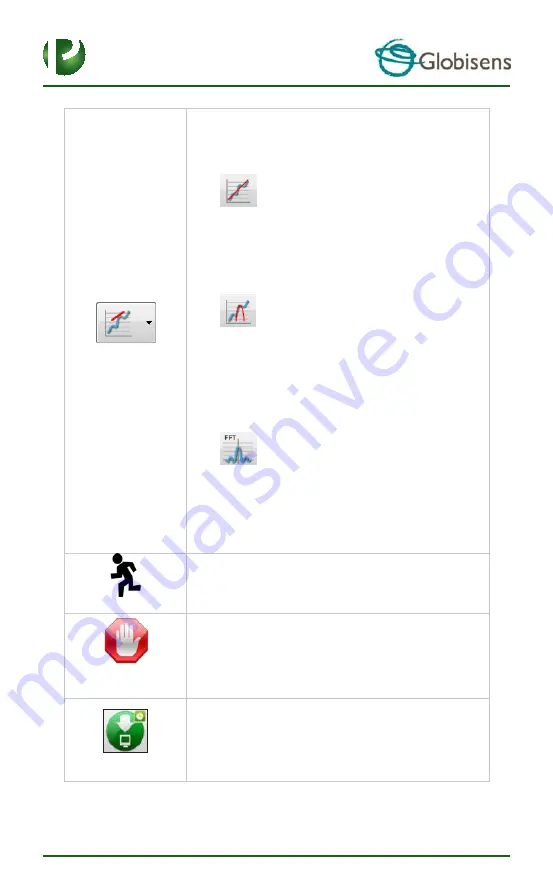
Pressing the
Function-options
small triangle icon allows
the user to apply the mathematical functions listed below
between the graph markers:
1.
Selecting the
Linear regression
icon will
display the best linear line that fits the graph
between the locations of two markers. Next to the
line the software will open a small text box
displaying the linear line equation: Y= aX+b.
2.
Selecting the
Quadric
regression
icon will
display the best parabolic line (2
nd
degree) that fits
the graph between the locations of two markers.
Next to the line the software will open a small text
box displaying the parabolic line equation: Y=
aX²+bX+c.
3.
Selecting the
FFT
icon will split the graphic
display and show the original measurement on a
time scale in the top graphic window, and its
harmonics, on a frequency scale in the bottom
graphic window.
Selecting the
Run
icon launches a new data collection
session.
Selecting the
Stop
icon ends the current data collection
session.
Selecting the
Selective download
icon opens a table listing
all stored recordings. Selecting one of the lines on the
table and pressing download will download this specific
recording to the computer.


