Performance Charts
Performance Charts
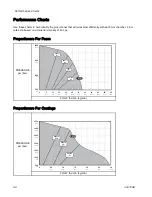
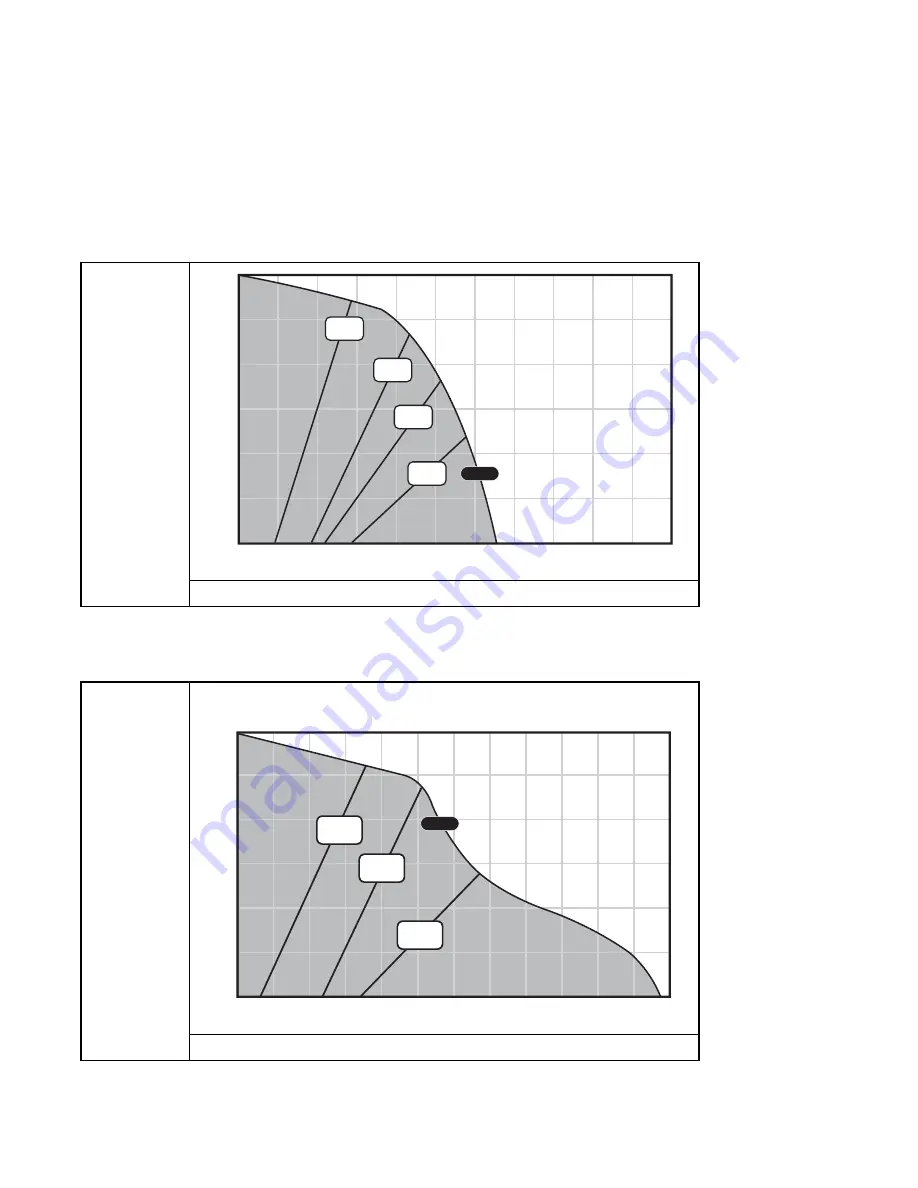
Use these charts to help identify the proportioner that will work most efficiently with each mix chamber. Flow
rates are based on a material viscosity of 60 cps.
Proportioners For Foam
AR6060
(03)
AR7070
(04)
AR5252
(02)
AR4242
(01)
2000
(138)
1500
(103)
1000
(69)
500
(34)
0
5
(2.3)
15
(6.8)
20
(9.1)
25
(11.3)
30
(13.6)
35
(15.9)
45
(20.4)
40
(18.1)
55
(25.9)
50
(22.7)
10
(4.5)
E-30i
PRESSURE
psi (bar)
FLOW lbs/min (kg/min)
Proportioners For Coatings
3500
(241)
3000
(207)
2500
(172)
2000
(138)
1500
(103)
1000
(69)
500
(34)
AR2020
(000)
AR4242
(01)
AR2929
(00)
E-XP2i
0
0.5
(1.9)
1.5
(5.7)
1.0
(3.8)
2.0
(7.6)
2.5
(9.5)
3.0
(11.3)
PRESSURE
psi (bar)
FLOW lbs/min (kg/min)
96
3A1705E
Summary of Contents for 259079
Page 34: ...Setup A5 A1 A2 AS AN A3 AT A3 A4 A2 A6 A4 34 3A1705E...
Page 45: ...Advanced Display Module ADM Operation Setup Screens Navigation Diagram Figure 35 3A1705E 45...
Page 49: ...Advanced Display Module ADM Operation Run Screens Navigation Diagram Figure 36 3A1705E 49...
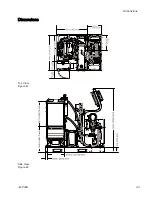
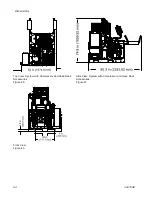
Page 93: ...Dimensions Dimensions Top View Figure 43 Side View Figure 44 3A1705E 93...
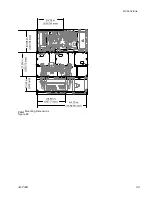
Page 95: ...Dimensions Pallet Mounting Dimensions Figure 48 3A1705E 95...
Page 97: ...Notes Notes 3A1705E 97...

