gSKIN
®
U-Value KIT: Instruction Manual
5 / 12
green
TEG
AG
Hofwisenstr. 50A
8153 Rümlang, Switzerland
T: +41 44 515 09 15
info@greenTEG.com
greenTEG.com
and analysed (the latest data set will be preselected, all data sets are ordered by the measurement start
time).
10.
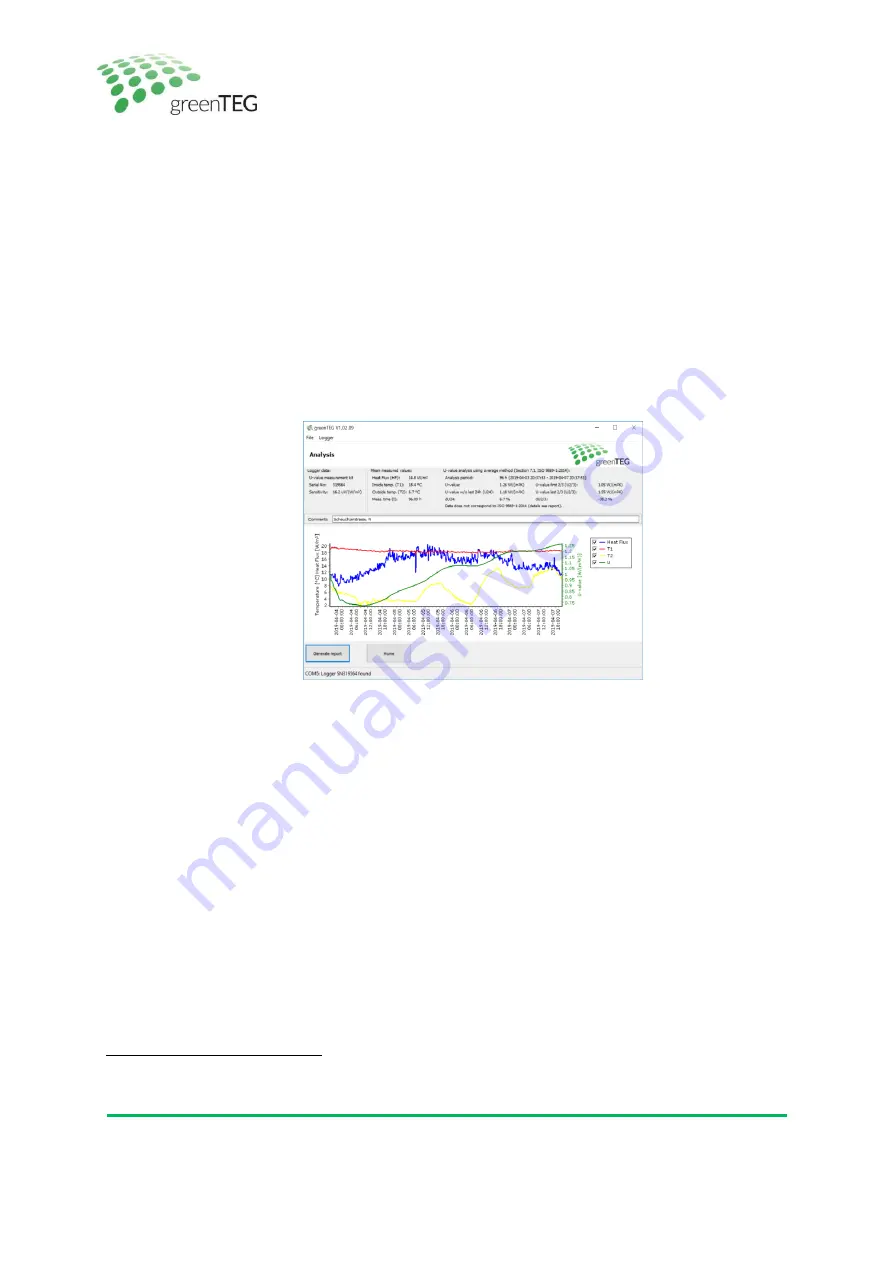
By selecting the latest logging file, you can review the logged data set. In the newly opened window
named
“
Analysis
“, you will find
the last measured data points (see Figure 4). The values stated in the
header of the window are explained in detail in Appendix A. A graphical review of the measured data is
given in the chart:
−
Blue line: Heat flux (corresponding to primary y-axis)
−
Read line: Indoor temperature T1 (corresponding to primary y-axis)
−
Yellow line: Outdoor temperature T2 (corresponding to primary y-axis)
−
Green line: Calculated U-value (corresponding to secondary y-axis)
−
Dotted vertical line: Start of analysis period
Th
e section “comments” shows the comments made regarding your latest me
asurement activity (see
step 7); comments can be changed afterwards
3
.
Figure 4: Analysis window showing U-value output and sensor data graphs.
11.
To save the graph as a PDF or printing it directly, press
the “Generate report” button. The “
Generate PDF
”
button generates a PDF file (see Figure 4)
, “
” leads you to your printing settings
. The PDF gives more
details about the measurement v
alues than the window “Analyse record”. A detailed explanation of the
parameters used in the report is given in Appendix A.
3
In order to save this comment, you need to save the report as a PDF (see step 11), otherwise this comment will be overwritten
by your next comment. So, be aware that if you are reviewing an old data set, it doesn’t show the orig
inal comments anymore.
You can correct this again by simply revising the text in
the box after “Comments” (see F
igure 3).


