13
•
If you still encounter problems, you can try resetting the Display (discussed in the Making Changes
to Your Configuration chapter).
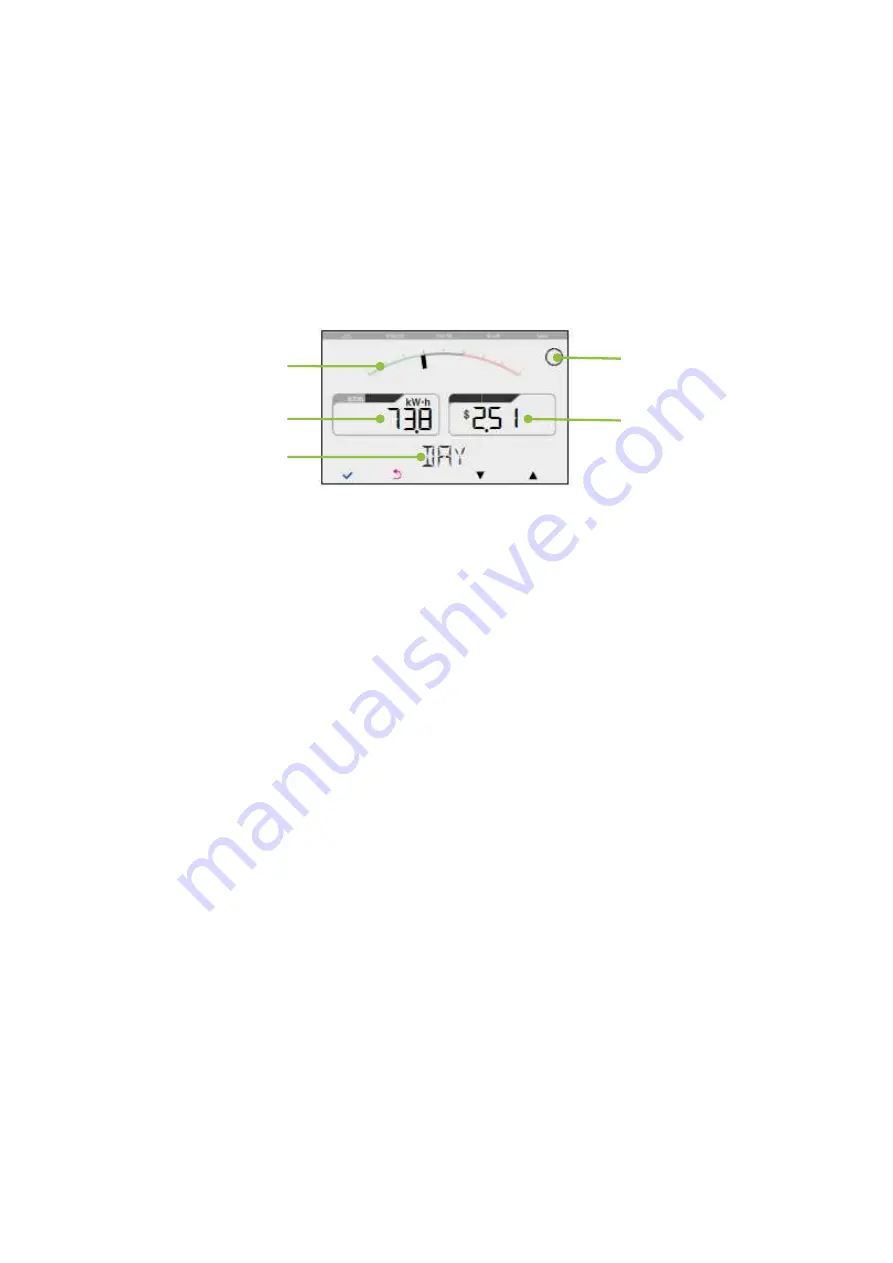
Current Cost and Usage
To view your current energy cost (if available) and usage, press the left or right Display buttons until the
CURRENT screen appears. In addition to this current information, you can view cost and usage information for
the entire day, previous week, and previous month by pressing the up and down buttons while on the CURRENT
screen.
1.
Gauge shows how your usage for the selected timeframe compares with your average usage. The closer the
indicator is to the left side of the gauge, the lower your current usage is, as compared to your average. The
closer the indicator is to the right side, the higher your current usage is, as compared to your average.
2.
KWh shows how much energy you are using in kilowatt hours for the selected timeframe.
3.
Timeframe shows the duration over which the information is based. Available timeframes include the entire
day, previous week, and previous month. Press the up and down buttons to access these other timeframes.
4.
Icon shows network status. A broken circle means the Display is not connected to the Gateway. A full circle
means the Display is connected but no service is available. A full circle with G means the Display is
connected and service is available.
5.
Cost shows your total cost for energy used during the selected timeframe.
1
3
5
2
4
Summary of Contents for DE220-1
Page 2: ...In Home Display DE220 1 DE220 1 A...
Page 7: ......
Page 39: ...www greenwavereality com...


