Page 9
DLT 2.0 Differential Level Transmitter
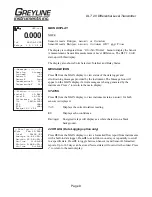
MAIN DISPLAY
NOTE
Sensor A reads
Range
,
Level
or
Volume
Sensor B reads
Range
,
Level
,
Volume
HRT
and
Flow
The display is configured from “
Units/Mode
” menu to display the Sensor
A measurement, Sensor B measurement or Level Difference. The DLT 2.0 will
start-up with this display.
The display also shows Units Selected, Totalizer and Relay States.
MESSAGE ICON
Press
from the MAIN display to view status of the data logger and
error/warning messages provided by the instrument. The Message Icon will
appear on the MAIN display if error messages are being generated by the
instrument. Press
to return to the main display.
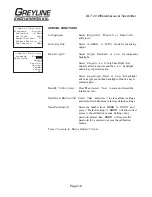
STATUS
Press
from the MAIN display to view instrument status.
Level
for both
sensors is displayed.
Tot
Displays the current totalizer reading.
EC
Displays echo confidence.
Relays
Energized relays will display as a white character on a black
background.
24 HR LOG (Data Logging option only)
Press
from the MAIN display to view a formatted flow report from instruments
with a built-in data logger. Press
to scroll down one day or repeatedly to scroll
to a specific date. Press
to toggle between Sensor A and Sensor B formatted
reports. Up to 365 days can be stored. Newest date will overwrite the oldest. Press
to return to the main display.
USG/min
Tot 20130.8 USG
Relays 1 2 3 4 5 6
0.000
--Message-----------
Data log
Stopped
Log Used
0%
Sensor A
Good
Sensor B
Good
Temperature A
21C
Temperature B
21C
--Status------------
.00ft
}
Level A
12
Level B
11.30ft
Difference
0.70ft
20130.8USG
Tot
EC
100%
A
EC B
100%
Relays 1 2 3 4 5 6
--24 hr log-------- -
B
Date
Feb. 12/20
}
10
50138 USG
Total
34.82 USG/m
Average
52.20 USG/m
Maximum
11:08:00
Max Time
0.000 USG/m
Minimum
9:15:00
Min Time


