49
7.7.2 Overview
1.
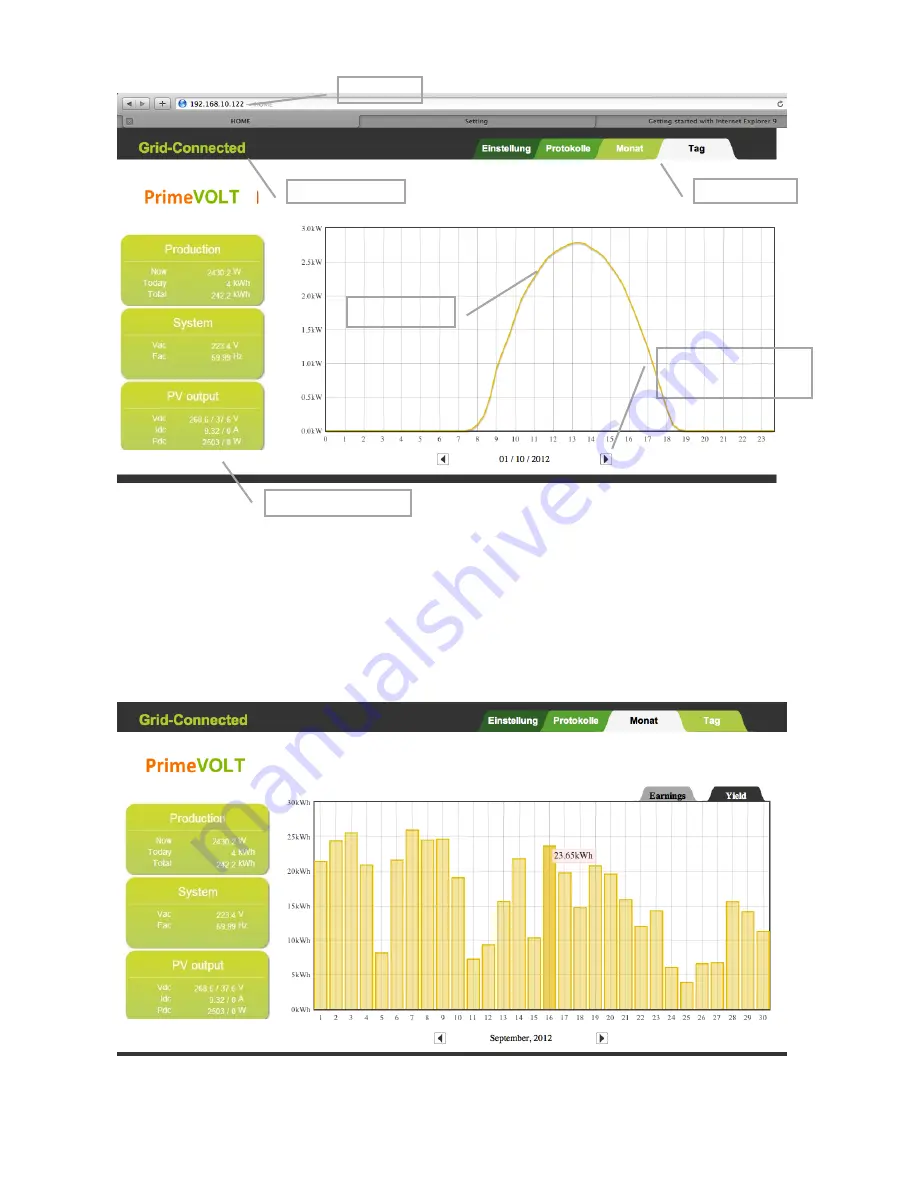
Display Tabs: There are 4 selections available.
a.
Day: Yield graphs of the day
b.
Month: Bar Graphs of a month. When pointing cursor to a
specific day, the corresponding yield of that day will highlight
automatically. See picture below for illustration
IP address
Display Tabs
Daily Graphs
Information Board
Inverter Status
Forward/Backward
Tabs
Summary of Contents for PV-10000T-U
Page 12: ...11 5 4 Product Labels ...
Page 14: ...13 6 2 Unpacking PV 15000T U ...
Page 15: ...14 6 3 1 Unpacking PV 20000T U ...
Page 16: ...15 6 3 2 Unpacking PV 20000T U E Display ...
Page 17: ...16 6 4 Assembly Chart PV 5000T U PV 8000T U PV 10000T U PV PV15000T U ...
Page 18: ...17 6 5 Assembly Chart PV 20000T U ...
Page 81: ...80 14 Addendum 14 1 Efficiency Charts 14 1 1 PV 5000T U 14 1 2 PV 8000T U ...
Page 82: ...81 14 1 3 PV 10000T U 14 1 4 PV 15000T U ...
Page 83: ...82 14 1 5 PV 20000T U ...
Page 84: ...P N MUB0 A00000 0 ...


