A
B
C
D
E
F
G
H
I
J
K
L
M
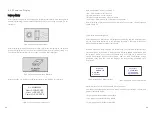
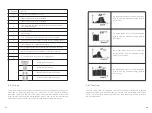
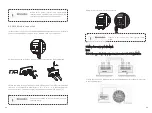
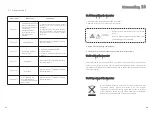
Position
Text line for displaying an event
Input voltage and current of MPPTA
Input voltage and current of MPPTB
PV array A and B, Light when the array voltage is above the
start voltage(250Vdc)
Current power
Daily energy
Total energy generated since the inverter was installed
Light when the array voltage is above the start voltage(250Vdc)
Lighted when “H” is lighted and feed-in
Output phase of the line conductor, switch every 5 seconds
Output voltage /current /frequency of the line conductor
Graphical display of the inverter energy/power
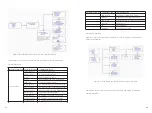
Detail
RS
232
communication
RS
485 communication
External wireless communication
Internal wireless communication
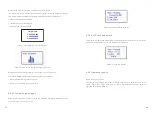
6.4.2 Graph
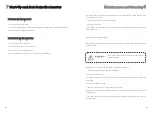
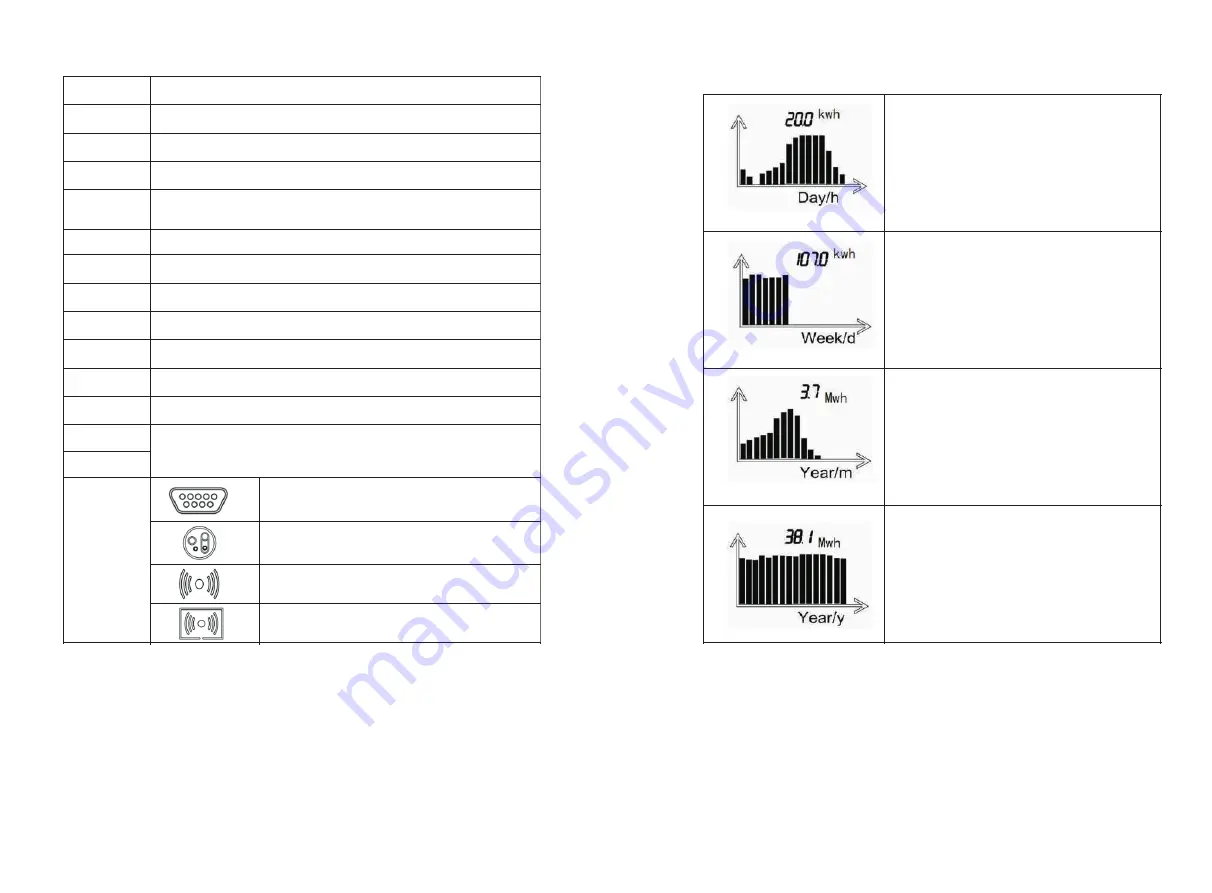
The inverter energy and/or power is shown as a graph on the display. The lower right-
hand bar of the graph represents the current unit of time: Day/h, Week/day,
Month/M, Year/Y. The top bar of the graph represents the maximum value of the
graph values. The daily graph is displayed by default. You can trip the enclosure lid
three times to switch the current unit of time and the generation information
.
The graph shows recent 16 hours the energy
yield of and the maximum energy yield of
the 16 values.
The graph shows recent 7 days the energy
yield of and the maximum energy yield of
the 7 values.
The graph shows recent 12 months the
energy yield of and the maximum energy
yield of the 12 values.
The graph shows recent 16 years the energy
yield of and the maximum energy yield of
the 16 values.
6.4.3 Text line
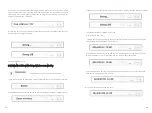
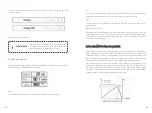
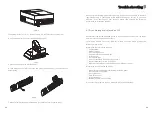
The Text line is used for displaying an event. Include the information of setting
language, models, communication address, and time. The “Power Rate” and “Power
Factor” are take turn to display by default. You need input“123” before enter into
the setting interface
.
47
48


