Growatt New Energy.CO.LTD
www.ginverter.com
49
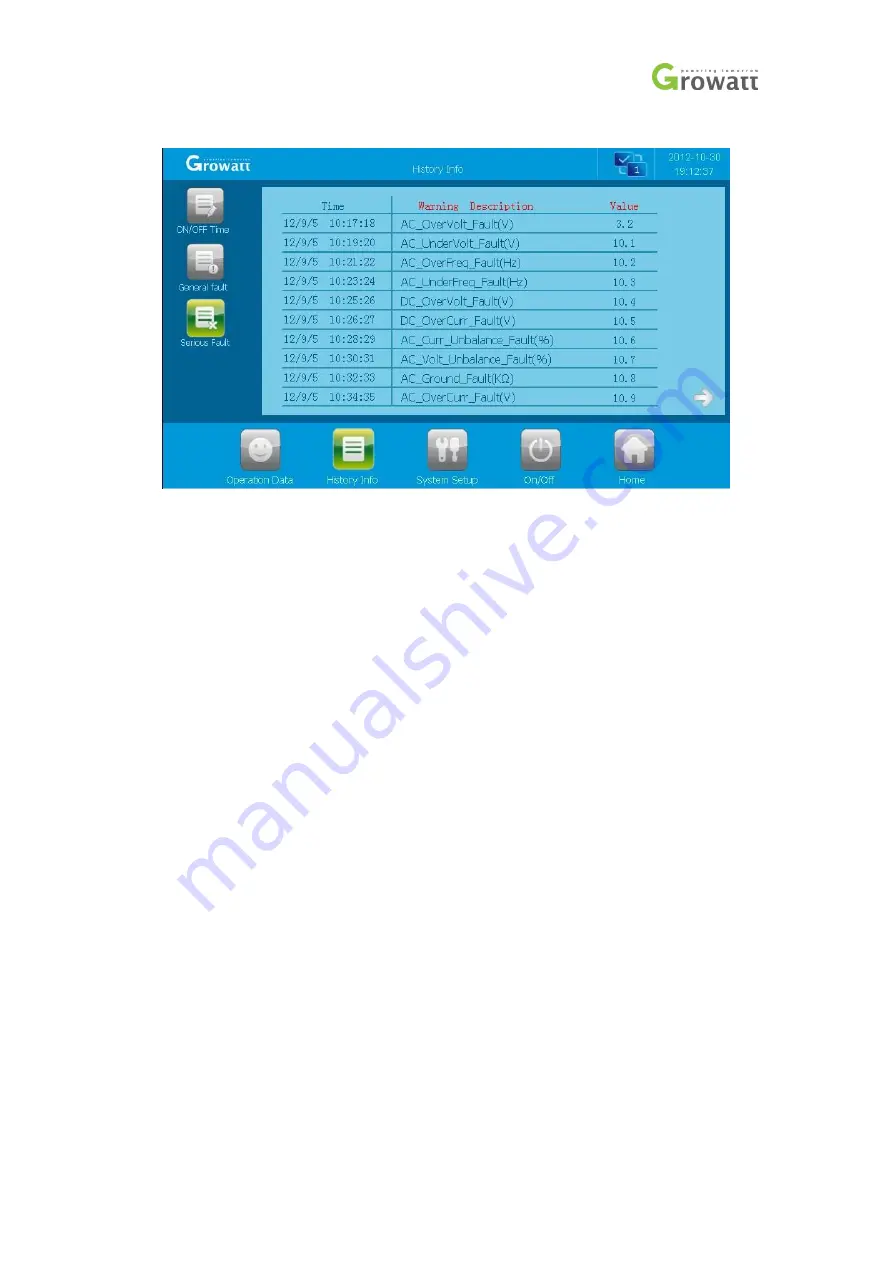
Figure 6-2-5-3
6.2.6 Operation data
Clicking the “Operation data” in any interface will enter into the submenu of “operation data”.
The sub-menu includes: real-time data, the power curve, and energy yield figure. Pressing the left
button can enter into the corresponding sub menu interface. The default interface is the real-time
data interface.
Insert USB Disk on the back of the LCD display, and the real time operation data will be stored in
the USB Disk in every minute. Inverter will create a “CSV” format file every month in the USB
disk for data storage.
Real-time data: current PV power generation parameters and real-time data including the grid
voltage, the grid frequency, the grid current, DC input voltage, DC input current, the internal
temperature of the chassis as well as the total power generation time (updated in real time). When
total power is more than 100,000KW, it will be measured by MK; when total power is less than
100,000KW, it will be measured by KW.


