Mini-X Installation, Setup & User Manual GRT Avionics
Revision A9 77
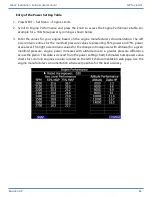
CHT/EGT Time History Display
The EGT and CHT time history graphs are only viewable on the History Engine Page. The graphs
show a two-minute window. The right side of the graph represents the current time. The last 10
minutes of history may be reviewed by turning the knob. When the most recent two minutes are
not being displayed, the temperature range is replaced with the age of the information being
displayed.
The 10-minute window allows a pilot to remain focused on flying tasks until their workload permits
an in-flight review of the data. Data recording features can also be enabled to record engine data
to a USB memory stick for later review on the ground.
EGT time history provides the most insight into engine operation. Practically any change in the
engine’s operation will cause a change in exhaust gas temperature. During periods of throttle
movement or when varying loads are placed on the engine, it can be difficult to determine if small
changes are abnormal. However, this is not an issue during cruise flight. Even during climbs and
descents, temperatures change slowly, making it easy to notice sudden changes that are associated
with abnormal engine behavior.
If (or when) you suspect that the engine might be running abnormally, make it a habit to look at
the EGT times history. Problems with a single cylinder will be noted as one EGT abruptly changing
more than the other EGTs. When a problem causes a significant loss in power to one cylinder, the
bad cylinder’s reading will drop significantly, with those of the unaffected cylinders also dropping,
though to a lesser extent, as they take on more of the engine load. If all cylinders show a significant
change, up or down, the problem is affecting the entire engine. For example, if a magneto fails, all
EGTs will rise significantly.
In time, you will find that the EGT time history becomes your go-to whenever you’re unsure of
engine performance–it’s our most common reason for using them!
Depending on how your airplane is configured, you may have the option to display the EGT time
history during takeoff. If this is possible, we highly recommend doing so. You may, depending on
the circumstances, use this to judge whether an engine problem is likely to result in cylinder failure
or loss of the entire engine. This could impact how you react to the situation, be it heading for the
nearest open area or attempting to return to the airport.
Keep in mind that your EFIS supports the use of a heads-up display (HUD). The HUD provides all
primary flight data, allowing you to use your EFIS for engine monitoring during the takeoff.

