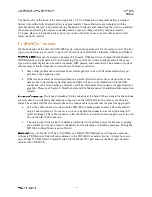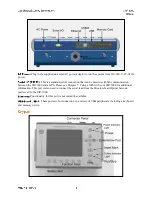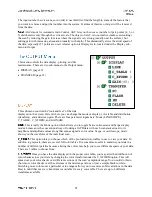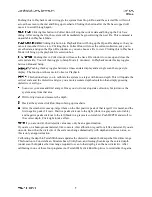
After the SIR 3000 boots up, you will see the introductory screen. There will be 6 icons positioned over
the Function Keys. The first one is TerraSIRch.
Pushing the Mark button switches your desired units between English and Metric.
TerraSIRch mode gives you complete control over all data collection parameters. Quick Start guides are
available for StructureScan and UtilityScan. The StructureScan Quick Start guide also covers the
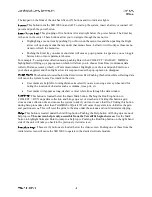
ConcreteScan functionality. Push the TerraSIRch button. After a moment, you will see a screen divided
into three windows and there will be a bar running across the bottom with commands above each of the 6
Function Keys.
After entering one of the six data collection modes, you can return to this screen by either clicking the
Power button twice or by removing the battery and AC power and reinserting it to re-boot.
For information on other modes, please see Chapter 6.
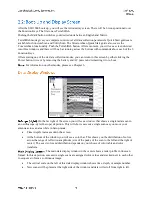
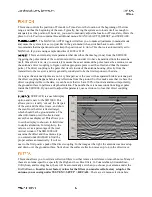
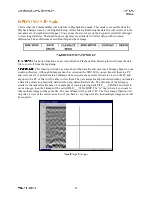
On the far right of the screen you will see a window that shows a single radar scan in
an oscilloscope-style (O-scope) depiction. This will show successive single scans as you move your
antenna across an area while in Setup mode.
Time (depth) increases down the screen.
At the bottom of the window you will see a color bar. This shows you the distribution of colors
across the range of reflection amplitudes (size of the peaks of the scan to the left and the right of
center). The exact color and distribution depends on your choice of color table and color
transform.
The main data display window in the center shows a radar profile in linescan
format. In this depiction, successive single scans are assigned color values and stacked next to each other
in sequence to form a continuous image.
The vertical scale on the left of this data display window shows time, depth, or sample number.
New scans will be placed at the right side of the window and data will scroll from right to left.


