9
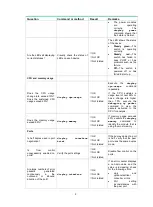
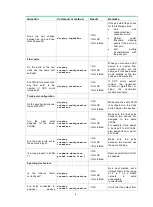
Question
Command or method
Result
Remarks
analyze the cause. You
can use the
display
ospf lsdb
command
multiple times to view the
age of routes and locate
the flapping route.
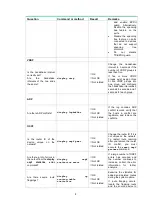
Is the OSPF status stable?
display ospf peer
□
OK
□
Not OK
□
Not related
View the up time of the
OSPF neighbor.
Routes
Is the default route
correct?
Are there any routing
loops?
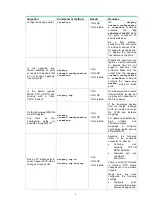
tracert
debug ip packet
□
OK
□
Not OK
□
Not related
Use the
tracert
command to trace the path
to a nonexistent network
(1.1.1.1, for example) to
check for routing loops. If a
routing loop exists, check
the configuration of the
involved devices for errors.
Adjust the route to remove
the loop.
Use the
debug ip packet
command to check for
packets with TTL 0 or 1. If
TTL exceeded packets are
received, check for network
route errors.
CPU security
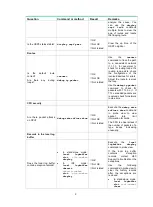
Are there packet attacks
on CPU?
debug rxtx softcar show
□
OK
□
Not OK
□
Not related
Execute the
debug rxtx
softcar show
command
in probe view to view
packet rate limit
information for cards.
The CPU is under attack if
the number of packets of a
type keeps increasing
unusually.
Records in the local log
buffer
Does the local log buffer
contain exception records?
•
In standalone mode:
local logbuffer
slot
slot-number
display
•
In IRF mode:
local logbuffer
chassis
chassis-number
slot
slot-number
display
□
OK
□
Not OK
□
Not related
Execute
the
local
logbuffer display
command in probe view.
If the local log buffer
contains exception
records,
contact
H3C
Support to troubleshoot the
exceptions.
Use the following
commands in probe view to
clear the history records
after the exceptions are
removed:
•
In standalone mode:
local logbuffer
slot
slot-number
clear

