16
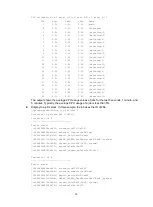
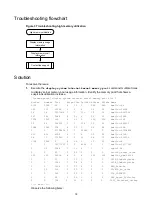
CPU utilization in 5 secs: 6.0%; 1 min: 5.6%; 5 mins: 5.7%
JID 5Sec 1Min 5Min Name
1 0.0% 0.0% 0.0% scmd
2 0.0% 0.0% 0.0% [kthreadd]
3 0.0% 0.0% 0.0% [migration/0]
4 0.0% 0.0% 0.0% [ksoftirqd/0]
5 0.0% 0.0% 0.0% [watchdog/0]
6 0.0% 0.0% 0.0% [migration/1]
7 0.0% 0.0% 0.0% [ksoftirqd/1]
8 0.0% 0.0% 0.0% [watchdog/1]
9 0.0% 0.0% 0.0% [migration/2]
10 0.0% 0.0% 0.0% [ksoftirqd/2]
11 0.0% 0.0% 0.0% [watchdog/2]
12 0.0% 0.0% 0.0% [migration/3]
13 0.0% 0.0% 0.0% [ksoftirqd/3]
14 0.0% 0.0% 0.0% [watchdog/3]
15 0.0% 0.0% 0.0% [migration/4]
16 0.0% 0.0% 0.0% [ksoftirqd/4]
17 0.0% 0.0% 0.0% [watchdog/4]
18 0.0% 0.0% 0.0% [migration/5]
19 0.0% 0.0% 0.0% [ksoftirqd/5]
20 0.0% 0.0% 0.0% [watchdog/5]
21 0.0% 0.0% 0.0% [migration/6]
The output shows the average CPU usage values of jobs for the last 5 seconds, 1 minute, and
5 minutes. Typically, the average CPU usage of a job is less than 5%.
2.
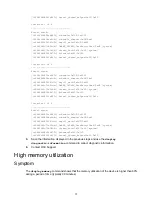
Display the job's stack. In this example, the job uses the ID of 284.
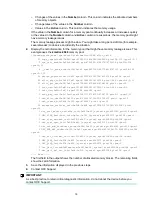
[Sysname-probe]follow job 284 slot 1
Attaching to process 284 ([OPTK])
Iteration 1 of 5
------------------------------
Kernel stack:
[<ffffffff804ad9f0>] s0x710/0x1050
[<ffffffff804ae5d8>] schedule_0x98/0xe0
[<ffffffff803187d0>] kepo0x2d0/0x450
[<ffffffffc71b29d4>] DWARE_OPTMOD_Ta0xa4/0xd0 [system]
[<ffffffffc72e1894>] thre0x74/0x90 [system]
[<ffffffff80266470>] 0x140/0x150
[<ffffffff8021d910>] kernel_thread0x10/0x20
Iteration 2 of 5
------------------------------
Kernel stack:
[<ffffffff804ad9f0>] s0x710/0x1050
[<ffffffff804ae5d8>] schedule_0x98/0xe0
[<ffffffff803187d0>] kepo0x2d0/0x450
[<ffffffffc71b29d4>] DWARE_OPTMOD_Ta0xa4/0xd0 [system]
[<ffffffffc72e1894>] thre0x74/0x90 [system]
[<ffffffff80266470>] 0x140/0x150

