5-36
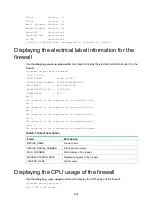
3% in last 5 seconds
3% in last 1 minute
3% in last 5 minutes
Table5-2 Output description
Field
Description
Slot 1 CPU 0 CPU usage
CPU 0 usage information for the interface module in slot 1.
3% in last 5 seconds
Average CPU usage in the last 5 seconds. (After the firewall boots, the firewall
calculates and records the average CPU usage at the interval of 5 seconds.)
3% in last 1 minute
Average CPU usage in the last minute. (After the firewall boots, the firewall
calculates and records the average CPU usage at the interval of 1 minute.)
3% in last 5 minutes
Average CPU usage in the last 5 minutes. (After the firewall boots, the firewall
calculates and records the average CPU usage at the interval of 5 minutes.)
Displaying the memory usage of the firewall
Use the
display memory
command to display the memory information of the firewall.
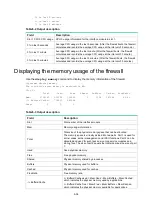
<Sysname> display memory
The statistics about memory is measured in KB:
Slot 1:
Total Used Free Shared Buffers Cached FreeRatio
Mem: 1718140 921604 796536 0 1108 187644 46.4%
-/+ Buffers/Cache: 732852 985288
Swap: 0 0 0
Table5-3 Output description
Field
Description
Slot
Slot number of the interface module
Mem
Memory usage information.
Total
Total size of the physical memory space that can be allocated.
The memory space is virtually divided into two parts. Part 1 is used for
kernel codes, kernel management, and ISSU functions. Part 2 can be
allocated and used for such tasks as running service modules and
storing files. The size of part 2 equals the total size minus the size of part
1.
Used
Used physical memory.
Free
Free physical memory.
Shared
Physical memory shared by processes.
Buffers
Physical memory used for buffers.
Cached
Physical memory used for caches.
FreeRatio
Free memory ratio.
-/+ Buffers/Cache
-/+ Buffers/Cache:used = Mem:Used – Mem:Buffers – Mem:Cached,
which indicates the physical memory used by applications.
-/+ Buffers/Cache:free = Mem:Free + Mem:B Mem:Cached,
which indicates the physical memory available for applications.

