32
0% in last 5 seconds
0% in last 1 minute
0% in last 5 minutes
Table 11 Output description
Field Description
Slot 1 CPU 0 CPU usage CPU 0 usage information for the interface module in slot 1.
0% in last 5 seconds
Average CPU usage in the last 5 seconds. (After the firewall boots, the firewall
calculates and records the average CPU usage at intervals of 5 seconds.)
0% in last 1 minute
Average CPU usage in the last minute. (After the firewall boots, the firewall
calculates and records the average CPU usage at intervals of 1 minute.)
0% in last 5 minutes
Average CPU usage in the last 5 minutes. (After the firewall boots, the firewall
calculates and records the average CPU usage at intervals of 5 minutes.)
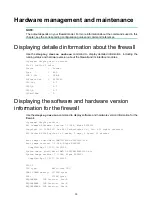
Displaying the memory usage of the firewall
Use the
display memory
command to display the memory information of the firewall.
<Sysname> display memory
Memory statistics are measured in KB:
Slot 1:
Total Used Free Shared Buffers Cached FreeRatio
Mem: 32870736 4244812 28625924 0 2048 200756 87.1%
-/+ Buffers/Cache: 4042008 28828728
Swap: 0 0 0
Table 12 Output description
Field Description
Slot
Slot number of the interface module.
Mem Memory
usage information.
Total
Total size of the physical memory space that can be allocated.
The memory space is virtually divided into two parts. Part 1 is used for
kernel codes, kernel management, and ISSU functions. Part 2 can be
allocated and used for such tasks as running service modules and
storing files. The size of part 2 equals the total size minus the size of part
1.
Used
Used physical memory.
Free Free
physical
memory.
Shared
Physical memory shared by processes.
Buffers Physical
memory used for buffers.
Cached
Physical memory used for caches.
FreeRatio
Free memory ratio.
-/+ Buffers/Cache
-/+ Buffers/Cache:used = Mem:Used – Mem:Buffers – Mem:Cached,
which indicates the physical memory used by applications.
-/+ Buffers/Cache:free = Mem:Free + Mem:B Mem:Cached,
which indicates the physical memory available for applications.

