70 of 96
PBViewer Program for Statistical Analysis - 3624 ProBrix Plus
Operator Manual
ORBISPHERE
6.5 Graph Menu
6.5.1 Customize
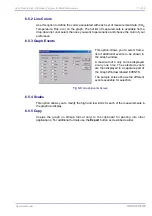
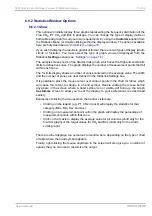
From the
General
window, these include the title bars, color or black and white, the data
displayed in either or both tabular and graphical form. Choose the styles that suit you
best.
Select the
Plot Style
tab to define how the graphs should be displayed (bar graph, line
graph, etc.). These can be different for each measurement (Brix, CO
2
, etc.)
The
Subsets
tab allows you to define which sets of measurement data you wish to
display. For example you can choose to display only the Temperature and Brix graphs.
Select which graphs to display. To select a series of adjacent graphs, click on the graph
at the top of your selection and then (whilst holding down the
Shift
key) click on the
bottom of your selection. Alternatively, to select on an individual basis, click on your first
selection, then hold down the
Ctrl
key and click on your next and subsequent selections.
Select the
Points
,
Font
and
Color
tabs and personalize your graphical displays to suit
your requirements.
Once you have made all your changes, select the
Apply
button to apply these changes
to your current display. Once you are happy with all the changes, select the
OK
button to
store the changes and return you to the Graph Window.
Any changes you make will be stored in the file and will be used next time you open that
particular measurement file. However, should you wish to return to the default settings at
any time then select the
Original
button.
The
Export
button lets you export the data to an external source. This would typically be
the Clipboard, a File or the Printer. The dialog box associated with this button guides you
through the various options.
For a full screen view of the display window, use the
Maximize
button.
Select
Cancel
to ignore all changes and return to the Graph Window.
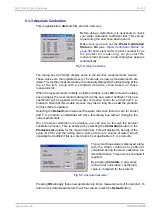
This option gives you multiple
ways of customizing the output.
As you can see from the sample
screen shot there are numerous
options on how to display the
Graph Window.
Fig 6-7:
Graph Customize Screen
Summary of Contents for ORBISPHERE 3624
Page 1: ...Operator Manual ORBISPHERE 3624 Revision F 03 10 2008 ...
Page 2: ......
Page 14: ...8 of 96 Manual Overview 3624 ProBrix Plus Operator Manual ORBISPHERE ...
Page 32: ...26 of 96 Installation 3624 ProBrix Plus Operator Manual ORBISPHERE ...
Page 60: ...54 of 96 PC Program Setup 3624 ProBrix Plus Operator Manual ORBISPHERE ...
Page 68: ...62 of 96 Calibrations 3624 ProBrix Plus Operator Manual ORBISPHERE ...
Page 82: ...76 of 96 Accessories and Attachments 3624 ProBrix Plus Operator Manual ORBISPHERE ...
Page 98: ...92 of 96 Glossary 3624 ProBrix Plus Operator Manual ORBISPHERE ...
Page 101: ...3624 ProBrix Plus User Notes 95 of 96 Operator Manual ORBISPHERE User Notes ...
Page 102: ......

