3624 ProBrix Plus - PBViewer Program for Statistical Analysis
Operator Manual
ORBISPHERE
6.6.2 Statistics Window Options
6.6.2.1 Show
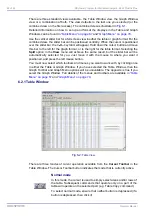
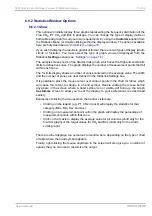
This option will initially display three graphs representing the frequency distribution of the
True CO
2
, PT CO
2
and Brix in package. You can change the type of display (table or
both table and graph) to suit your own requirements by using the
Customize
option from
the Statistics Menu (or double clicking within the display window). The options available
here are fully described in
.
If you wish to display the results in graphical format, there are two types of display (Alarm
Limits or %Limits). You must select the type of graph you want displayed from the
Statistics
Settings
option (see
The sample screen shot is of the Alarm Limits graph, which uses the High and Low Alarm
limits to define five zones. The graph displays the number of measurement points that fall
within each zone.
The %Limits display shows a number of zones centered on the average value. The width
and the number of zones are user defined in the Statistics Settings box.
It is possible to place the mouse cursor over various points in the chart (or table), which
will cause the cursor to change to a hand symbol. Double clicking the mouse button
anywhere in the screen where a hand symbol is not visible will bring up the Graph
Customize
screen to allow you to set the display to your preferences (as described
earlier).
Examples of clicking the mouse when the hand is visible are:
• Clicking on the legend (e.g. PT CO2 in pack) will display the statistics for that
category (Max, Min, Dev and Ave)
• Clicking on a measurement point within the graph will display the percentage of
measurement points within that zone.
• Click on the X-axis to display the average value for all columns (valid only for the
%Limits graph) or the target values for CO
2
and Brix (valid only for the Alarm
Limits graph)
There are other displays, too numerous to mention here, depending on the type of chart
or table where the hand symbol appears.
Finally, right clicking the mouse anywhere in the screen will also give you a number of
options that you can use to customize the output.
Summary of Contents for ORBISPHERE 3624
Page 1: ...Operator Manual ORBISPHERE 3624 Revision F 03 10 2008 ...
Page 2: ......
Page 14: ...8 of 96 Manual Overview 3624 ProBrix Plus Operator Manual ORBISPHERE ...
Page 32: ...26 of 96 Installation 3624 ProBrix Plus Operator Manual ORBISPHERE ...
Page 60: ...54 of 96 PC Program Setup 3624 ProBrix Plus Operator Manual ORBISPHERE ...
Page 68: ...62 of 96 Calibrations 3624 ProBrix Plus Operator Manual ORBISPHERE ...
Page 82: ...76 of 96 Accessories and Attachments 3624 ProBrix Plus Operator Manual ORBISPHERE ...
Page 98: ...92 of 96 Glossary 3624 ProBrix Plus Operator Manual ORBISPHERE ...
Page 101: ...3624 ProBrix Plus User Notes 95 of 96 Operator Manual ORBISPHERE User Notes ...
Page 102: ......


