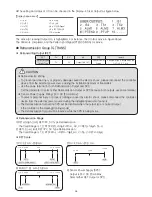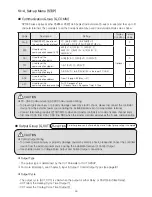
44
●
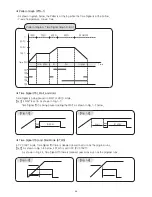
Pattern Graph (PTN-1)
●
Time Signal (TS), Wait, and Hold
●
Time Signal (TS) and Start Mode (ST.MD)
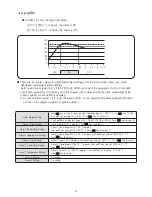
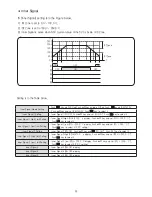
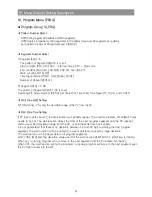
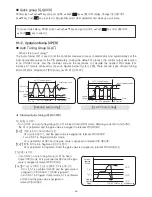
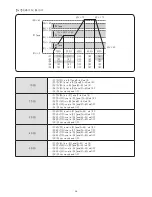
•As shown in graph below, the Patter is at the top while the Time Signal is at the bottom.
•Y-axis: Temperature, X-axis: Time
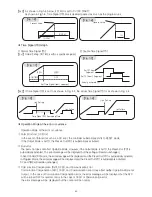
Time Signal is being paused in WAIT or HOLD mode.
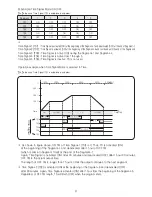
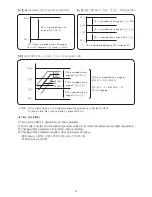
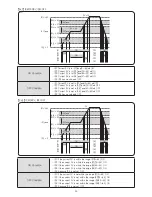
【Ex.1】 If WAIT is set to as shown in Fig. 1-1;
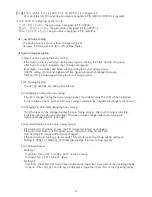
Time Signal (TS) is being paused during the WAIT as shown in Fig. 1-2 below.
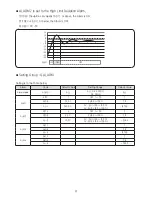
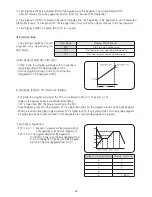
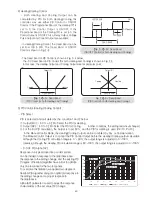
In PV START mode, Time Signal (TS) time is deemed passed as much as the program runs.
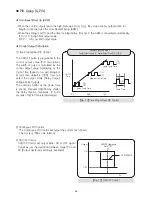
【Ex.2】 As shown in Fig. 1-3 below, if ST.MD is set to PV (PV START);
As shown in Fig.1-4, Time Signal (TS) time is deemed passed as much as the program runs.
Time
TS1
TS2
TS3
TS4
TS5
Time (TM)
100℃
200℃
300℃
℃
1H 30M
1시간 30분
2시간 30분
1시간
지시값 (PV)
지시값 (PV)
2H
1H
1H 30M
1H
SEGMENT
Pattern Diagram, Time Signal Graph Format
4SEG
3SEG
2SEG
1SEG
1H 30M
10Min.
【Fig. 1-1】
1H 30M
Wait
10Min.
【Fig. 1-2】
【Fig. 1-3】
【Fig. 1-4】
Summary of Contents for NP200
Page 2: ......

