Settings Pages
45
Modero G4 Touch Panels - Configuration & Programming Manual
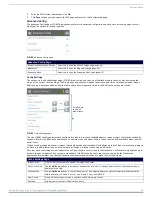
Diagnostics
The
Diagnostics
page (FIG. 64) allows access to panel logs, network statistics, ICSP statistics, and the panel connection utility.
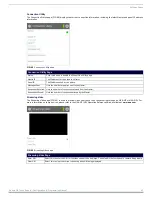
Logs
The
Logs
page (FIG. 65) chronicles all previous connections between the device and the network.
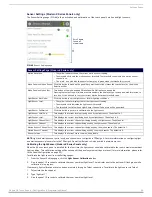
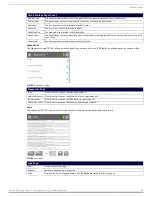
Cache Settings Page (Cont.)
RAM Max Size:
Displays the maximum RAM size for this panel before the least recently used items are discarded.
RAM Hit Rate:
The percentage of recent image requests satisfied by accessing the RAM cache.
RAM Items:
The total number of cached images in the RAM cache.
Flash Size:
The size of the current Flash cache contents.
Flash Max Size:
The maximum size allocated to the Flash cache.
Flash Hit Rate:
The percentage of dynamic image requests not satisfied by accessing the RAM cache, but satisfied by accessing the
Flash cache.
Flash Items:
The total number of cached images in the Flash cache.
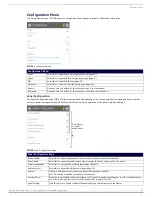
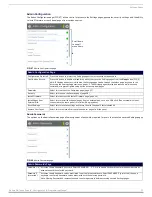
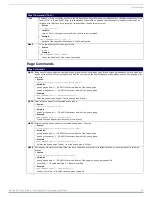
FIG. 64
Diagnostics page
Diagnostics Page
Logs:
Click this button to open the
Logs
page (page 45).
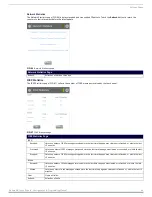
Network Statistics: Click this button to open the
Network Statistics
ICSP Statistics:
Click this button to open the
ICSP Statistics
page (page 46).
Connection Utility: Click this button to open the
Connection Utility
page (page 47).
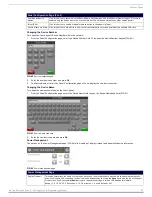
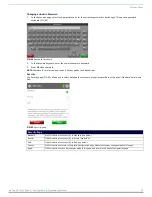
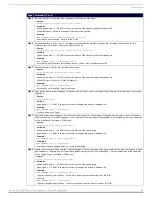
FIG. 65
Logs page
Logs Page
Clear:
Clears all connection logs.
Refresh:
Refreshes displayed log information.
Page:
Displays the current log page number. Use the
Up
/
Down
arrows to select log pages.


