Manage System
38
Vision
2
Instruction Manual
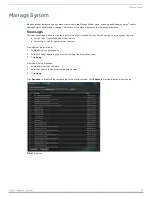
Click
Refresh
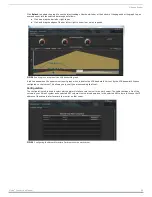
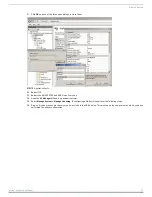
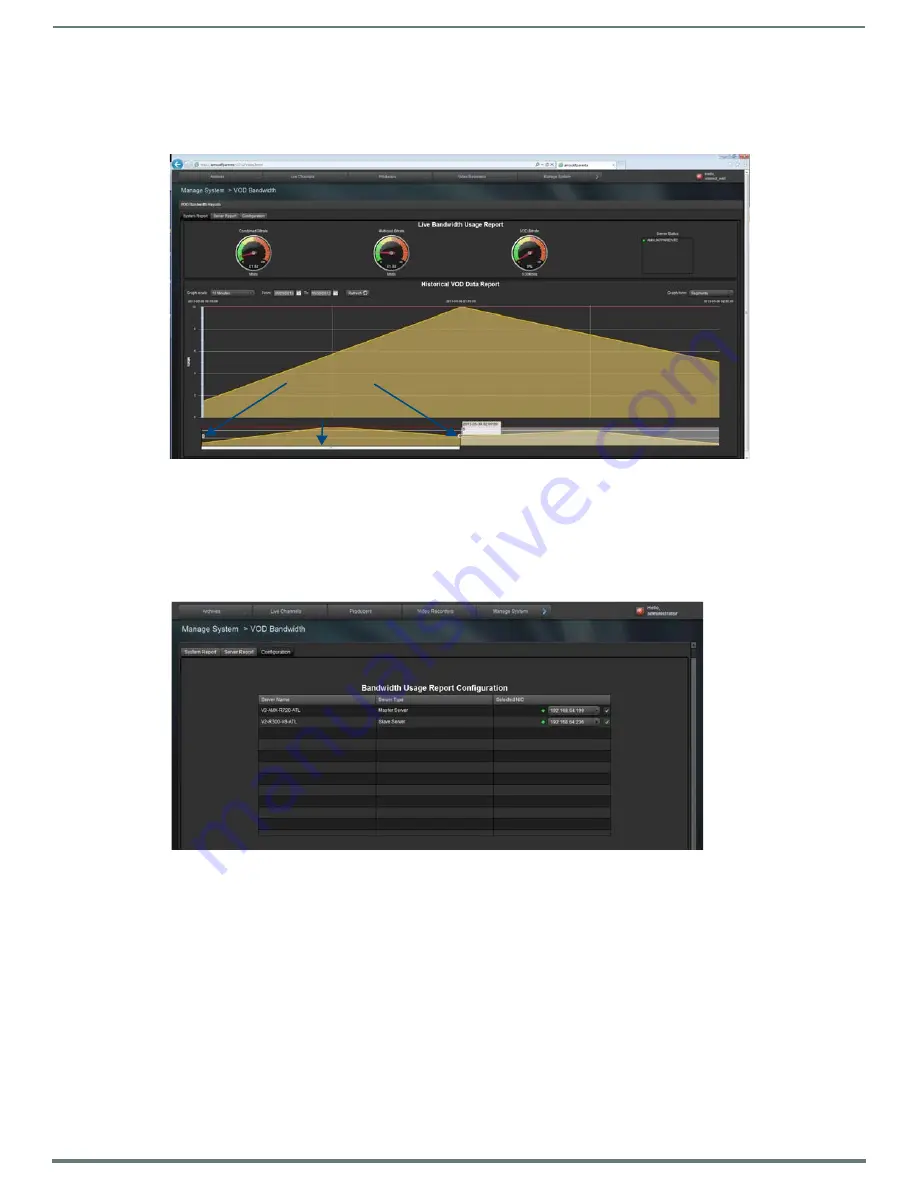
to update the graph to see the latest readings. Use the white bar at the bottom of the page under the graph to pan
over and zoom into the selected data range as follows:
Click and drag the bar left or right to pan
Click and drag the edges of the bar left or right to zoom in or out as required.
A red line appears on the upper server report graph which indicates the VOD bandwidth limit set by the VOD bandwidth license
configured on that server. This allows you to see if you are exceeding that limit.
Configuration
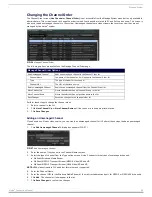
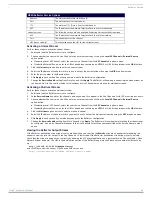
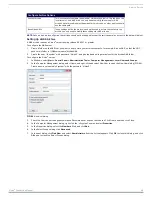
The configuration tab is used to select which network interface card to monitor on each server. The table contains a list of the
servers in your Vision2 system and a selected NIC column. Use the drop down icon in the selected NIC column to choose the IP
address of the network interface card to monitor on that server.
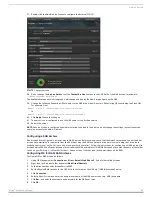
FIG. 54
Zooming in on a region of the VOD bandwidth graph
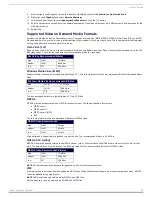
FIG. 55
Configuring the Network Interface Card to monitor on each server
Drag bar to pan
Drag to zoom

