Constellation®
January 2006
7-2 Performance
Curves
Threshold-to-Interference (T/I) Ratios
Overview
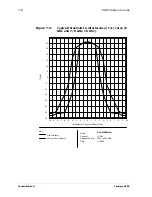
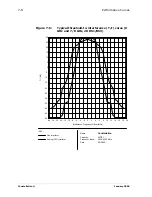
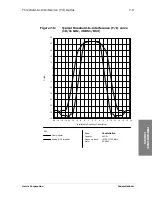
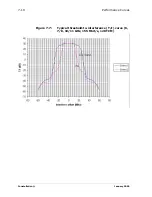
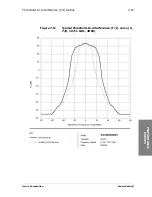
The T/I curve shows the strength of interference and the frequency away from
the carrier required to degrade the 10
-6
BER (bit error ratio) state threshold
and the 10
-3
BER dynamic/outage thresholds by 1 dB. Measurements were
made by fading the wanted received signal level (RSL) until the 10
-6
BER point
is found (T). A modulated interfering signal is then added until the 10
-6
BER
point is degraded by 1 dB (I). The measurement is also made with a CW
interfering signal which emulates an analog radio FM emission. The ratio is the
T/I. The T/I curve is used for choosing radio frequency assignments and to find
the fade margin in congested areas. T/I curves plotting allowable T/I versus
frequency offset of the interfering signal must be on file with the frequency
search companies and are therefore available for all Harris digital microwave
radios.
Example: if 10
-6
BER threshold is -80 dBm and T/I is 30 dB, then the allowable
interference level at threshold is -80 dBm minus 30 dB = -110 dBm.
Summary of Contents for Constellation
Page 1: ...Microwave Digital Radios Constellation Systems Application P N SAI 112874 E09...
Page 2: ......
Page 3: ...CONSTELLATION MICROWAVE RADIO SYSTEM APPLICATION MANUAL PART NO SAI 112874 E09 JANUARY 2006...
Page 4: ...Constellation January 2006...
Page 18: ...Constellation January 2006 xii Preface...
Page 20: ...Constellation January 2006 xiv Preface...
Page 24: ...Constellation January 2006 1 4 General Information...
Page 92: ...Constellation January 2006 6 10 Antenna Coupling Unit ACU...
Page 110: ...Constellation January 2006 7 18 Performance Curves...
Page 124: ...Constellation January 2006 Index 6...
Page 125: ......
Page 126: ...6 0LFURZDYH RPPXQLFDWLRQV LYLVLRQ DYLV ULYH 0RUULVYLOOH 1 86 ZZZ KDUULV FRP 86 DQDGD RUOGZLGH...

