background image

37

 78.1  

SR/lb dry air

7000

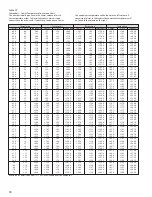
Use of the Psychrometric Chart 


From two known properties of air, its condition can be located on 

the Psychrometric chart and all remaining properties can then be 

found by reading the appropriate scale.

 
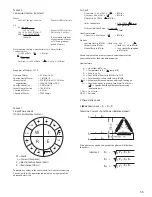
Figure 1 Illustrates a condition plotted at the intersection of its 

dry bulb and wet bulb temperatures. The dry bulb temperature 

is represented on the chart by the vertical lines with its scale 

across the bottom. The wet bulb temperature is read  along 

the saturation line and is represented on the chart by the solid 

diagonal lines. Enthalpy at a saturation, for a given wet bulb 

temperature is read from the diagonal scale at the left using the 

diagonal lines extending from the saturation line. 

 
Figure 2 Illustrates a condition plotted at the intersection of its 

dry bulb temperature and relative humidity. Relative humidity is 

represented on the chart by the curved lines which are marked in 

percent relative humidity.

Figure 3 Illustrates a condition plotted at the intersection 

of its dry bulb and dew point temperatures. The dew point 

temperature is read along the saturation line at the intersection 

of the Horizontal Humidity line. The value of the specific humidity 

is read from the scales at the right in either pounds or grains of 

moisture per pound of dry air by selecting the appropriate scale.

Figure 4 Illustrates the determination of specific volume from the 

chart. Specific volume is represented by the broken diagonal lines 

marked in cubic feet per pound of dry air. Intermediate points are 

read by interpolation between the lines.

Figure 5 Illustrates the use of sensible heat factor to determine 

the air conditions required to satisfy a specified space 

temperature and load conditions. The sensible heat factor is the 

ratio of internal sensible heat to internal total heat load of the 

space being conditioned. A straight line from the sensible heat 

factor scale through the circled point of the chart to the slope line 

from the space condition point to the saturation line. Air supplied 

to the space at any temperature condition located on the ratio 

line (and in the proper volume) will satisfy the room load.

Example — Using the point which is circled on the Psychrometric 

Chart, the following values are obtained:


Dry Bulb Temperature 

80.0ºF.


Wet Bulb Temperature 

67.0ºF.


Dew Point Temperature 

60.3ºF.


Relative Humidity 

51.1%


Specific Humidity


     A) 0.01115 lbs./lb. dry air =


     B) 78.1 grains/lb. dry air


Enthalpy at saturation               31.62 BTU/lb. dry air


Specific Volume                         13.83 Cu. Ft./lb. dry air

Figure 6 … *Air Conditioned Process

1.  Cooling and Dehumidification — A decrease in both dry bulb


and specific humidity represented by a  line sloping   


downward and to the left. Total heat content (both sensible  


and latent heat) is decreased.

2.  Sensible Cooling — A decrease in dry bulb and sensible heat


content represented by a horizontal line directed to the loft


along the constant specific humidity line. Specific humidity


and dew point remain constant.

3.  Evaporating Cooling — (Air passed through spray water or


wetted surface at wet bulb temperature) – A decrease in dry  


bulb (reduced sensible heat content) and an increase in dew 


point and specific humidity (increased latent heat content) 


represented by a line sloping upward and to the left following 


a constant wet bulb line – no change in total heat content.

4.  Humidification — An increase in the specific humidity as a 


result of moisture added, represented by a line directed


upward.

5.  Heating and Humidification — An increase in both sensible


heat  and specific humidity, represented by a line sloping  


upward and to the right.

6.  Sensible Heating — An increase in dry bulb and sensible heat


content, represented by a horizontal line directed to the right 


along the constant specific humidity line, Specific humidity


and dew point remain constant.

7.  Chemical Drying — (Air passed through a chemical drying


agent) – A decrease in dew point and specific humidity,  


represented by a line sloping downward and to the right.

8.  Dehumidification — a decrease in the specific humidity as a


result of removing moisture, represented by a line directed 


downward.

Definitions

Dry Bulb Temperature — The temperature indicated by a 

thermometer, not affected by the water vapor content air.

Wet Bulb Temperature — The temperature of air indicated by 

a wet bulb thermometer; the temperature at which water, by 

evaporating into air, can bring the air to saturation adiabatically at 

the same temperature.

Dew Point Temperature — The temperature to which water vapor 

in air must be reduced to produce condensation of the moisture 

contained therein.

Relative Humidity — The ratio of actual vapor pressure in the 

air to the vapor pressure of saturated air at the same dry bulb 

temperature.

Specific Humidity (Moisture Content of Humidity Ratio) — The 

weight of  water vapor per pound of dry air.

Sensible Heat — Heat which when added or subtracted from 

the air changes only its temperature with no effect on specific 

humidity.

Latent Heat — Heat which effects a change of state without 

affecting temperature, as in evaporating or condensing moisture.

Enthalpy (Total Heat) — The sum of sensible and latent heat. In 

the chart, enthalpy represents units of total heat content above 

an arbitrary base in terms of BTU per pound of dry air.

Specific Volume — Volume per unit of weight, the reciprocal of 

density, in terms of cubic feet per pound of dry air.

Sensible Heat Factor — The ratio of internal sensible heat to 

internal total heat load.

Ratio Line — The line extending from the space condition to the 

saturation line at a slope determined by the sensible heat factor.

Fig 1 —

Dry Bulb and Wet Bulb

Fig 2 —

Dry Bulb and Relative 

Humidity

Fig 3 —

Dry Bulb and Dew Point

Fig 4 —

Specific Volume

Fig 5 —

Sensible Heat Factor

Fig 6 —

Air Conditioning Process 

* (See Above)

Summary of Contents for H-ENGM0408

Page 1: ...ENGM0408 April 2008 Replaces H ENGM0806 August 2006 Engineering Manual Head Pressure Control Valve Oil Separator Compressor Suction Accumulator Suction Filter Evaporator Condenser Liquid Line Solenoi...

Page 2: ...e it the number one choice of convenience store owners everywhere Right source Right parts Right now We are your link to a complete line of dependable and certified commercial refrigeration parts acce...

Page 3: ...s of various liquids and solids 18 16 Banana room refrigeration requirement 19 17 Meat cutting or preparation room 19 18 Rapid load selection for back bars 19 19 Refrigeration requirements for hardeni...

Page 4: ...arated into the following main sources of heat for a given 24 hour period 1 Transmission load 2 Air change load 3 Miscellaneous load 4 Product load Accuracy Accuracy in calculation is the first step i...

Page 5: ...y operated lift trucks are used in refrigerated rooms which represent a heat gain of 8 000 to 15 000 BTU hr or more over the period of operation If motor or loading conditions are not known then calcu...

Page 6: ...simplify the calculation and tabulation of refrigeration loads there are two forms available Bulletin Above32 05 is used for all rooms above 32 F 0 C Bulletin Below32 05 is used for all rooms below 32...

Page 7: ...x BTU lbs 24 hrs Table 8 For consideration of previously loaded product a multiplier of 5 is normally applied to the daily product load Line 4 Divide by No of Operating Hrs 16 to obtain BTUH Cooling R...

Page 8: ...lbs 24 hrs Table 8 b lbs stored x BTU lbs 24 hrs Table 8 For consideration of previously loaded product a multiplier of 5 is normally applied to the daily product load Line 4 Divide by No of Operating...

Page 9: ...e 7 x F Temp Drop For product pulldown time other than 24 hrs figure 24 hr load x 24 Pulldown Time 5 Product Load Respiration a lbs stored x BTU lbs 24 hrs Table 8 b lbs stored x BTU lbs 24 hrs Table...

Page 10: ...al Temp Drop b gallons of ice cream day x BTU gal Table 19 For product pulldown time other than 24 hrs figure 24 hr load x 24 Pulldown Time Divide by No of Operating Hrs 18 to obtain BTUH Cooling Requ...

Page 11: ...ice cream day x BTU gal Table 19 For product pulldown time other than 24 hrs figure 24 hr load x 24 Pulldown Time Divide by No of Operating Hrs 18 to obtain BTUH Cooling Requirement Equipment Selecti...

Page 12: ...Table 7 Product Load Figured 24 hr Pulldown a lbs day x Spec Heat above freezing x F Intial Temp Drop lbs day x Latent Heat Fusion lbs day x Spec Heat below freezing x F Intial Temp Drop b gallons of...

Page 13: ...0 6 Concrete Floor 4 8 5 200 225 250 275 300 325 350 375 400 425 450 475 500 525 550 575 600 Insulation Inches Heat Load BTU Per 24 Hours Per One Square Foot of Outside Surface Cork Glass Urethane or...

Page 14: ...1 7 0 36 0 41 1 86 2 09 2 17 2 43 2 49 2 79 2 85 3 24 30 1 1 0 24 0 29 0 58 0 66 2 00 2 24 2 26 2 53 2 64 2 94 2 95 3 35 25 3 9 0 41 0 45 0 75 0 83 2 09 2 42 2 44 2 71 2 79 3 16 3 14 3 54 20 6 7 0 56...

Page 15: ...months 8 0 0 50 0 31 53 40 Processed Cheese 40 65 70 12 months 19 0 0 50 0 31 56 40 Butter 40 75 85 1 months 4 to 31 0 50 0 25 23 Cream 35 40 2 3 weeks 31 0 0 66 0 80 0 36 0 42 79 107 Ice Cream 20 to...

Page 16: ...32 90 2 4 weeks 30 3 0 90 0 46 124 33 Pears 29 31 90 95 2 7 months 29 2 0 86 0 45 118 47 Peas Green 32 95 1 3 weeks 30 9 0 79 0 42 106 23 Peppers Sweet 45 50 90 95 2 3 weeks 30 7 0 94 0 47 132 41 Pep...

Page 17: ...0 5 85 11 55 11 00 25 75 Beans Green or Snap 4 60 5 70 16 05 22 05 Beans Lima 1 15 1 60 2 15 3 05 11 00 13 70 Beets Topped 1 35 2 05 3 60 Broccoli 3 75 5 50 8 80 16 90 25 00 Brussels Sprouts 1 65 4 15...

Page 18: ...s 150 0 76 104 35 Sheep 45 0 76 101 33 Hogs 180 0 54 106 35 Table 12 Heat equivalent of Occupancy BTU per HP HR Motor Connected Connected Losses Load Motor Load In Outside Outside HP Refr Space1 Refr...

Page 19: ...87 600 75 85 700 72 81 800 69 78 900 67 75 1000 65 73 1200 62 69 Room Loads based on continuous operation and includes allowance for average number of personnel processing equipment etc with glass pa...

Page 20: ...nd temperature design conditions Design Design Ground Dry Bulb Wet Bulb Temp State City F C F C F C Nebraska Omaha 95 35 78 26 60 16 Nevada Reno 95 35 65 18 65 18 New Hamp Concord 90 32 73 23 55 13 Ne...

Page 21: ...hr to be sure that the unit cooler is large enough to balance properly with the condensing unit Low relative humidity requirements permit higher T D which in turn will allow selection of unit coolers...

Page 22: ...of air for particular applications Derating Factors A Ambient B Altitude C Saturated Suction Temperature S S T D 50 Cycle Power In the selection of refrigeration equipment it should be noted that the...

Page 23: ...l 1 5 safety factor sometimes applied to handle initial high rate of product heat evolution Ice Cream Hardening 10 F Heavy Duty 10 hour pull down with product 30 frozen and a certain percentage over r...

Page 24: ...ere low and normal temperature is being maintained Allow sufficient space between rear of unit cooler and wall to permit free return of air Refer to unit manufacturers catalog for proper space Always...

Page 25: ...0 1 1 8 1 3 8 1 3 8 1 5 8 1 5 8 1 5 8 1 3 8 1 3 8 1 5 8 1 5 8 2 1 8 2 1 8 1 3 8 1 5 8 1 5 8 1 5 8 2 1 8 2 1 8 72 000 1 1 8 1 3 8 1 5 8 1 5 8 1 5 8 2 1 8 1 3 8 1 3 8 1 5 8 1 5 8 2 1 8 2 1 8 1 3 8 1 5 8...

Page 26: ...8 2 1 8 2 1 8 2 5 8 5 8 5 8 7 8 7 8 7 8 7 8 72 000 1 5 8 2 1 8 2 1 8 2 1 8 2 5 8 2 5 8 1 5 8 2 1 8 2 1 8 2 1 8 2 5 8 2 5 8 5 8 5 8 7 8 7 8 7 8 7 8 78 000 1 5 8 2 1 8 2 1 8 2 1 8 2 5 8 2 5 8 1 5 8 2 1...

Page 27: ...1 3 8 1 3 8 1 3 8 1 5 8 1 5 8 1 1 8 1 3 8 1 3 8 1 5 8 1 5 8 1 5 8 1 3 8 1 3 8 1 5 8 78 000 1 1 8 1 1 8 1 3 8 1 3 8 1 3 8 1 5 8 1 1 8 1 3 8 1 3 8 1 3 8 1 5 8 1 5 8 1 1 8 1 3 8 1 5 8 1 5 8 1 5 8 2 1 8...

Page 28: ...1 2 1 2 5 8 5 8 5 8 5 8 66 000 1 5 8 2 1 8 2 1 8 1 3 8 1 3 8 1 5 8 1 5 8 2 1 8 2 1 8 1 3 8 1 5 8 1 5 8 2 1 8 2 1 8 2 1 8 1 2 1 2 5 8 5 8 5 8 5 8 72 000 1 5 8 2 1 8 2 1 8 1 3 8 1 5 8 1 5 8 1 5 8 2 1 8...

Page 29: ...1 1 8 1 3 8 1 3 8 1 5 8 1 5 8 1 5 8 1 1 8 1 3 8 1 5 8 1 5 8 1 5 8 1 5 8 1 3 8 1 5 8 1 5 8 1 5 8 1 5 8 1 5 8 1 3 8 1 5 8 1 5 8 78 000 1 1 8 1 3 8 1 3 8 1 5 8 1 5 8 2 1 8 1 3 8 1 3 8 1 5 8 1 5 8 1 5 8 2...

Page 30: ...5 8 2 1 8 1 2 1 2 5 8 5 8 5 8 5 8 66 000 1 5 8 1 5 8 2 1 8 1 3 8 1 5 8 1 5 8 1 5 8 1 5 8 2 1 8 1 3 8 1 5 8 1 5 8 1 5 8 1 5 8 2 1 8 1 2 5 8 5 8 5 8 5 8 5 8 72 000 1 5 8 2 1 8 2 1 8 1 5 8 1 5 8 1 5 8 1...

Page 31: ...g Tee Straight Through 1 2 2 3 4 4 5 7 8 10 12 14 16 Table 25 Pressure Loss of Liquid Refrigerants in Liquid Line Risers Expressed in Pressure Drop PSIG and Subcooling Loss F Liquid Line Rise in Feet...

Page 32: ...3 8 7 8 1 1 8 7 8 1 1 8 1 1 8 100 1 5 8 1 1 8 1 3 8 1 1 8 1 3 8 1 3 8 180 000 50 1 5 8 1 1 8 1 3 8 1 1 8 1 3 8 1 3 8 100 1 5 8 1 3 8 1 5 8 1 3 8 1 5 8 1 5 8 240 000 50 1 5 8 1 3 8 1 3 8 1 3 8 1 5 8 1...

Page 33: ...1 3 27 26 39 63 86 1 24 134a 64 2 2 57 14 26 40 61 1 91 1 3 8 22 63 5 3 50 27 42 64 93 1 33 R507 404A 55 0 4 98 40 58 95 1 32 1 87 134a 90 9 3 65 20 37 57 87 1 30 1 5 8 22 90 0 4 96 37 59 90 1 33 1 8...

Page 34: ...6 7 44 111 2 40 0 104 219 2 73 3 164 327 4 26 1 15 5 0 7 2 45 113 0 40 6 105 221 0 73 9 165 329 0 25 6 14 6 8 7 8 46 114 8 41 1 106 222 8 74 4 166 330 8 25 0 13 8 6 8 3 47 116 6 41 7 107 224 6 75 0 16...

Page 35: ...2 F Density of Water 62 4 lbs Cu Ft Specific Heat of Water 1 BTU lb F Latent Heat of 970 BTU lb at 212 F Atm Vaporization 1054 3 BTU lb at 70 F Specific Heat of Ice 0 5 BTU lb F Latent Heat of Fusion...

Page 36: ...ubic Foot of Brick Building 112 120 1 Cubic Foot of Concrete 120 140 1 Cubic Foot of Earth 70 120 at 32 F at 70 F and 29 92 Hg To Convert Measurements From To Multiply By Cubic Feet Cubic Centimeters...

Page 37: ...ng A decrease in dry bulb and sensible heat content represented by a horizontal line directed to the loft along the constant specific humidity line Specific humidity and dew point remain constant 3 Ev...

Page 38: ...ure of 29 921 in HG Atmospheric Pressure at other altitude Altitude Pressure Ft in HG 1000 31 02 500 30 47 0 29 92 500 29 38 1000 28 86 2000 27 82 3000 26 83 4000 25 84 5000 24 90 6000 23 98 7000 23 0...

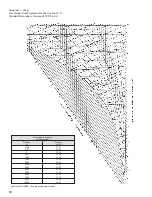
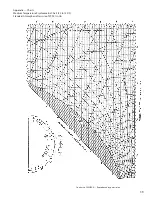
Page 39: ...39 Appendix Charts Medium Temperature Psychrometric Chart 32 to 130 F Standard Atmospheric Pressure of 29 921 in HG Courtesy of ASHRAE Reproduced by permission...

Page 40: ...antaneous evaporation of refrigerant in a pressure reducing device to cool the refrigerant to the evaporations temperature obtained at the reduces pressure 22 Flooded System system in which only part...

Page 41: ...x8 216 12775 16359 12072 15459 11807 16080 12767 17464 13726 18847 12x20x8 240 13681 17440 12928 16481 12573 17052 13599 18524 14626 19995 12x22x8 264 14549 18474 13749 17458 13299 17974 14392 19541 1...

Page 42: ...o loads to allow for service For product pull down greater than 10 degrees divide pull down temperature by 10 Multiply this number by the BTUH shown on Table A then add to Box Load Floor Approx 65 R H...

Page 43: ...at left of graph Follow it across to the straight line curve Then drop down to total load line at bottom of graph Total load for this example is 224 000 BTUH Select equipment accordingly Material orig...

Page 44: ...serve the right to make changes in specifications without notice CLIMATE CONTROL Commercial Refrigeration Parts The name behind the brands you trust Heatcraft Refrigeration Products LLC 2175 West Park...

Reviews: