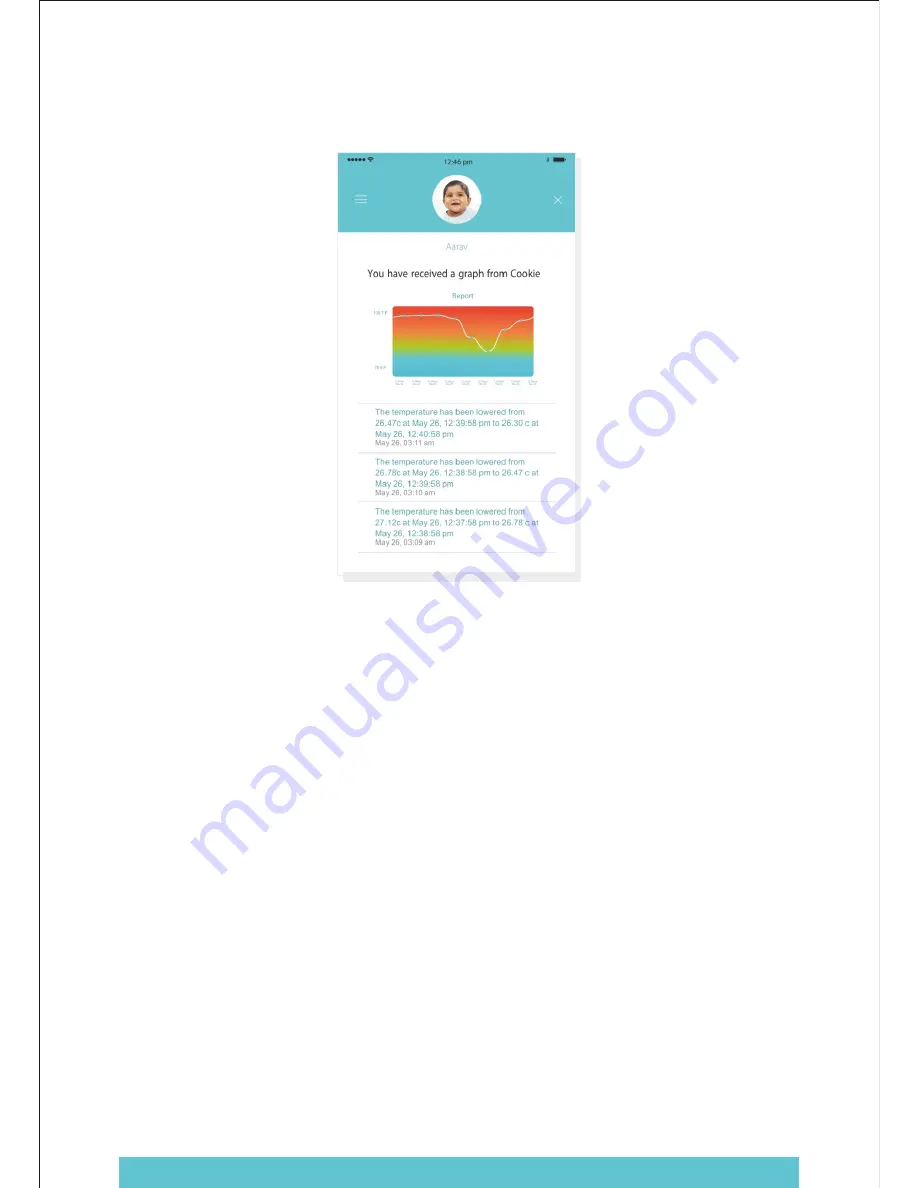
3. Clicking the graph icon on the top screen will display the temperature variations as a graph
plotted with date/time and temperature reading
4. You can share the graph with your CareNet users by clicking on the Share link in top of the graph
5. The graph will be sent as an image to members of your CareNet
Inbox
1. If you are member of another user's CareNet then the notifications from the CareNet owner will be
sent to your Inbox


