Examples for Node-RED
140/258
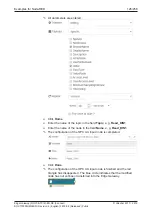
14. Selecting a signal:
Ø
Use
to open the signal list and select a
Signal
e.g.
input~fromController~Set_temperature_2
.
If the
signal
is not displayed, close the edit dialog with
Done
and
double-click to reopen the fieldbus node.
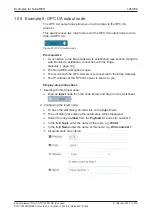
15. Finishing the fieldbus input node:
Ø
Click
Done
.
ð
The red triangle in the upper right corner has disappeared, i.e. the
configuration of the fieldbus input node is completed, but not yet
activated in the Edge Gateway.
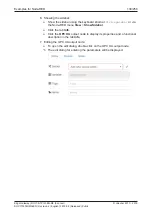
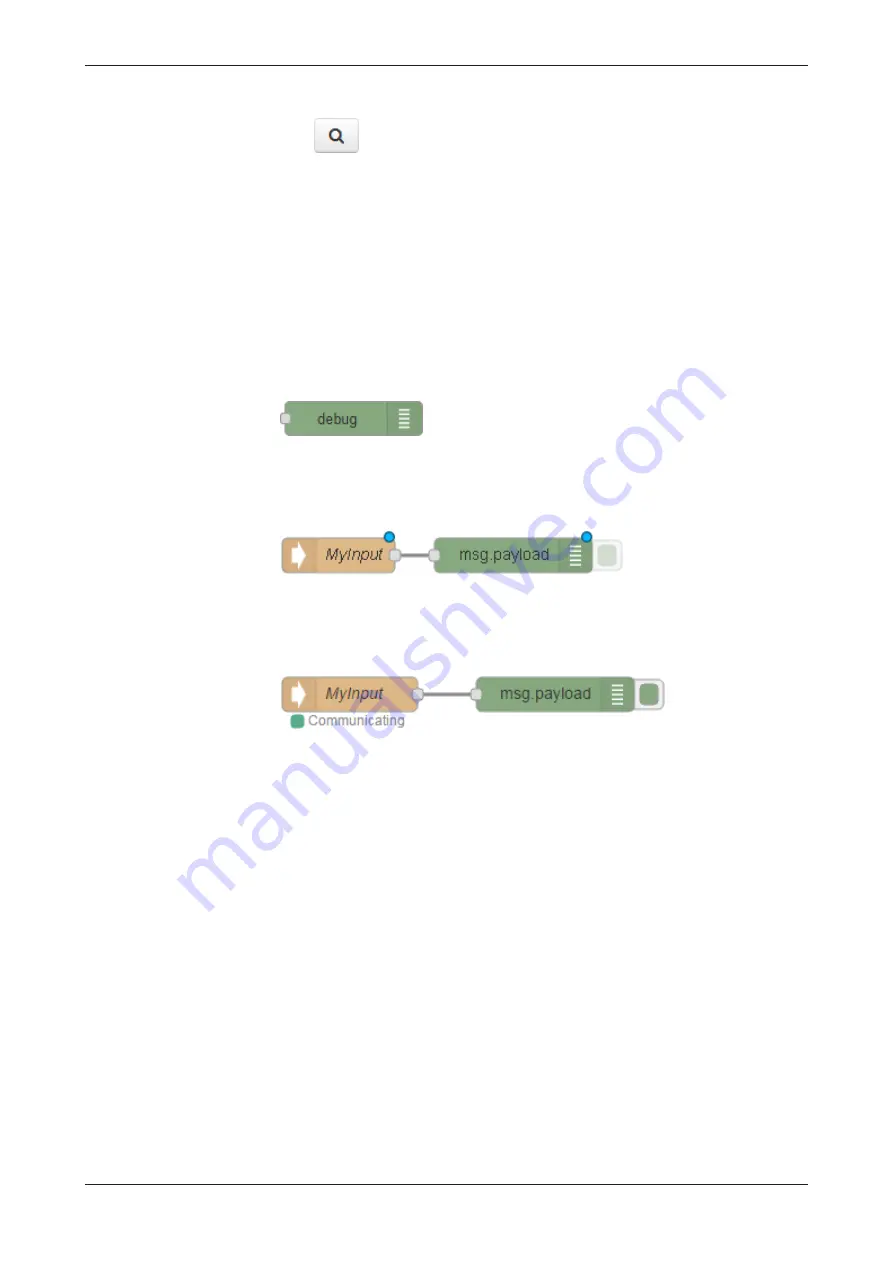
16. Inserting a Debug node:
Ø
Drag a
Debug
input node from the node library and drop it in the
worksheet.
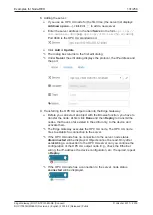
17. Connecting the nodes:
Ø
To connect the
fieldbus
node with the
Debug
node, hold down the left
mouse button and draw a connecting line (wire) from the output port of
the fieldbus node to the input port of the Debug node.
18. Deploy:
Ø
Click
Deploy
to transmit the nodes, that have so far existed in the editor
only, to the device and activate them.
ð
The flow is activated in the Edge Gateway.
ð
As soon as the value of the signal changes, the Debug output will
display the changed value/s and status information.
Edge Gateway | NIOT-E-TPI51-EN-RE (Connect)
DOC170502UM04EN | Revision 4 | English | 2018-08 | Released | Public
© Hilscher 2017 – 2018

