4.5 Automatically Importing (Saving) Recorded Data to a Computer, and Graph Display
53
3
4
Chapter 4 M
easure
ment a
n
d Analy
s
is
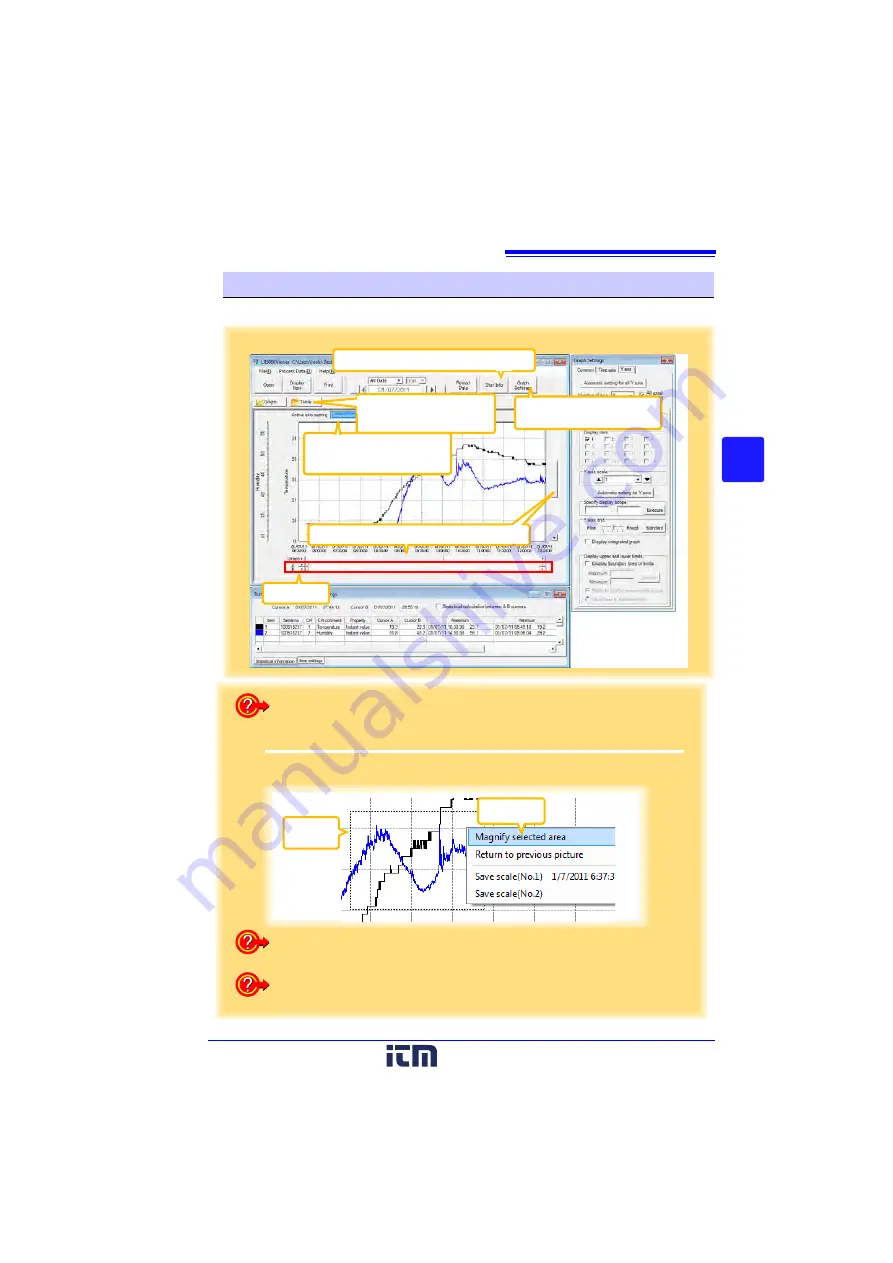
The main graph features are shown below.
Main Graph Features
Click the buttons to switch
between graph and table
displays.
Displays the
[Stat Info]
dialog box. (p.56)
Displays the
[Graph Settings]
dialog box. (p.54)
A/B cursors
When there are two or more
axes, select the one dis-
played closest to the graph.
Scroll Bar (scrolls the graph)
How can the displayed area be magnified?
Dotted
Box
Click
2
1
Drag over the area to be enlarged to enclose it in a dotted box.
2
Right click to open the pop-up menu, and click
[Magnify selected area]
.
How can graph line color and display be switched?
Change settings on the
[Item settings]
tab in the
[Statistical Information and
Item Settings]
dialog box. (p.56)
How can graph details be set?
Detailed settings are available in the
[Graph Settings]
dialog box. (p.54)
www.
.com
information@itm.com
1.800.561.8187


