4.1 Collecting Recorded Data of Logger
36
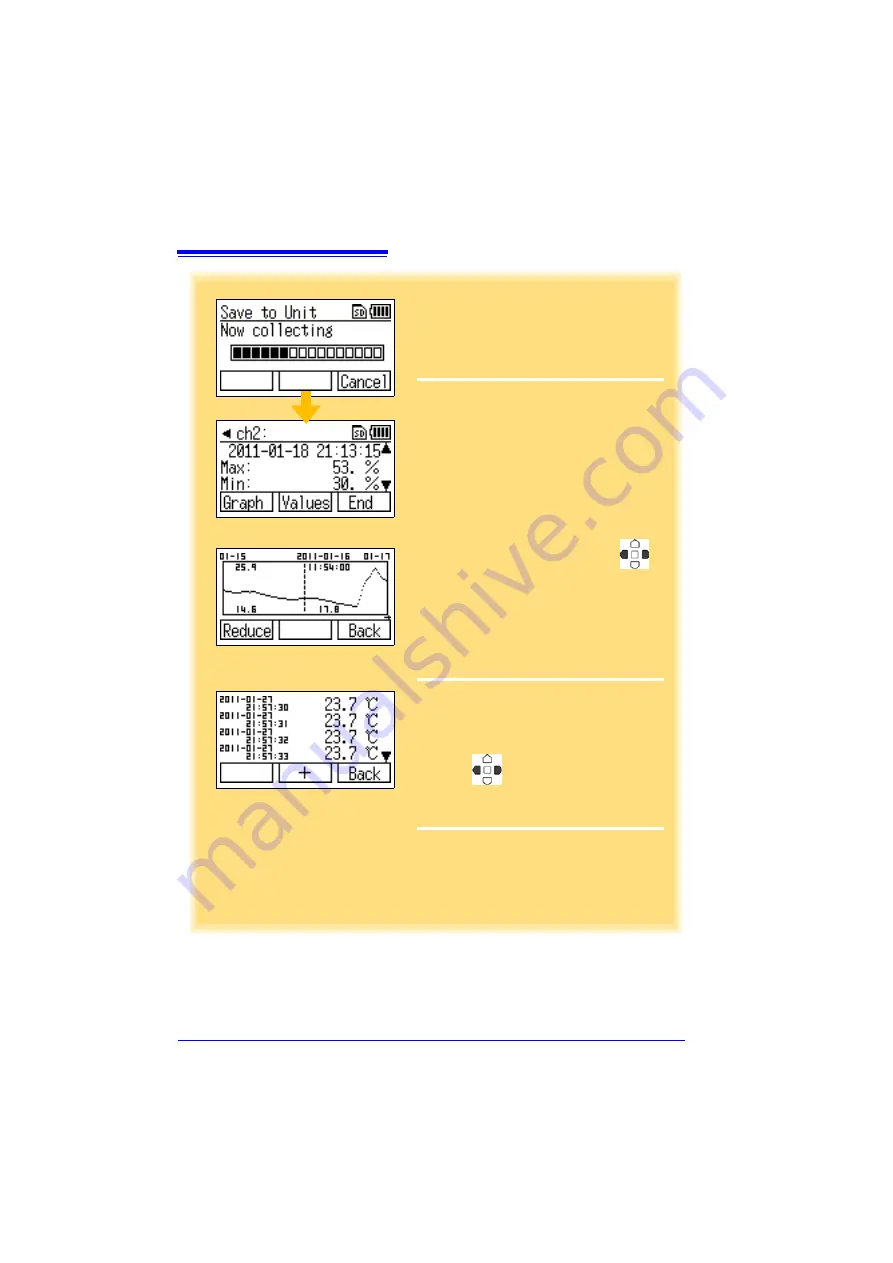
The display on the left is shown during
data collection.
When you want cancel data collection part way
through:
Press the
F3
button to return to the top display.
When collection is completed, the col-
lected data appears on the display.
The following shows the displayed infor-
mation.
(Channel, comment, data count, record-
ing interval, serial number, recording start
time, recording stop time, maximum
value, minimum value, and average
value)
When the data of a logger which recorded
on two channels is collected, use
to
switch channels.
Press the
F1
button to switch to waveform
graph display, and
F2
button to switch the
numerical value display.
(To return to the previous display, press the
F3
button.)
Waveform Graph Display
Press the
F1
button to reduce the wave-
form, and the
F2
button to magnify the
waveform.
Use
to scroll the waveform.
(To return to the previous display, press the
F3
button.)
Numerical Value Display
Use the
F1
and
F2
buttons to decimate
the data.
(To return to the previous display, press the
F3
button.)
Waveform Graph Display
Numerical Value Display
Collection Data Display
Summary of Contents for LR5092
Page 2: ......
Page 14: ...Preparation for Use to Data Analysis 8...
Page 36: ...3 6 Starting and Stopping Recording on Logger 30...
Page 44: ...4 1 Collecting Recorded Data of Logger 38...
Page 140: ...9 4 Disposing of the Logger 134...
Page 144: ...Index Index iv...
Page 145: ...HIOKI E E CORPORATION...
Page 146: ......
Page 147: ......
Page 148: ......


