background image

113

3

Cha

p

ter 9

  Ana

lyzing Dat

a

 on a Computer

9

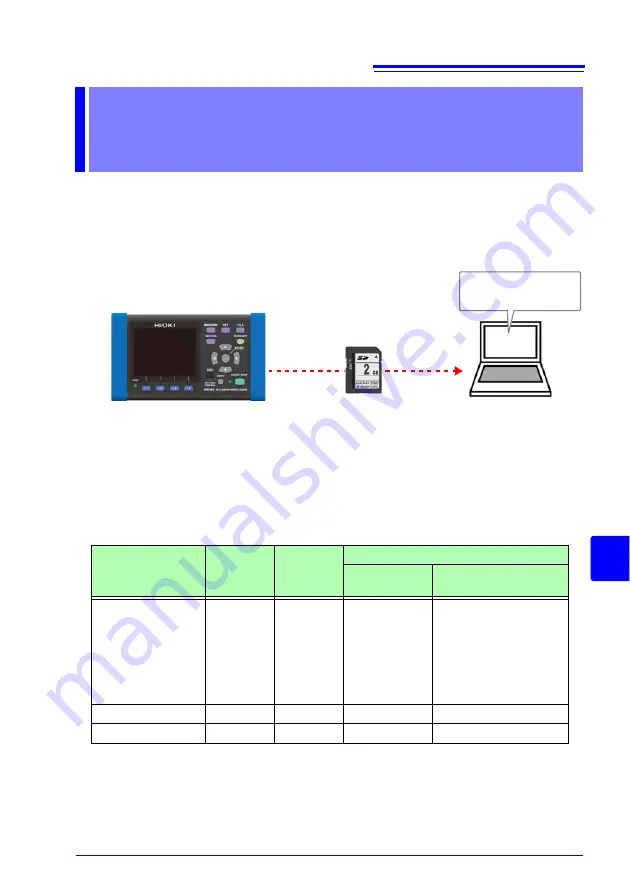
This section describes how to load data recorded with the instrument onto a com-

puter and analyze it using the optional SF1001 Power Logger Viewer application. 

Recording and measurement data can also be checked by loading it into Excel.

See:

SF1001 Power Logger Viewer Instruction Manual

To access data, either load it from the SD memory card on which it was saved using 

a computer with an SD memory card reader, or download it from the SD memory

card or the instrument’s internal memory to a computer using the instrument’s USB 

or LAN functionality.

See:

Chapter 10, "Using Communications (USB/LAN)" (p. 129)

Analyzing Data

on a Computer

Chapter 9

Model SF1001

Power Logger Viewer

Recording data

File content

Extension

Format

Supported application software

Model SF1001 

supported

Other than SF1001

Recording and 
measurement data

CSV

CSV

Available

• Spreadsheet soft-

ware

• PW3360 Auto 

Excel Graph Cre-
ation Application

(p. 128)

Screen copy

BMP

BMP

Not Available

• Graphics Software

Setting

SET

Text

Not Available

• Text editor

Summary of Contents for PW3360-20

Page 1: ...PW3360 20 PW3360 30 Instruction Manual CLAMP ON POWER LOGGER PW3360 30 CLAMP ON POWER LOGGER PW3360 20 February 2013 Edition 1 PW3360A981 00 13 02H Instruction Manual ...

Page 2: ......

Page 3: ...2 2 Preparing to Use the Instrument after Purchase 22 Bundle the Voltage Cord Leads with the Spiral Tubes 22 Wrapping Color coded Spiral Tubes around Clamp Sensors and Grouping Together Cables 23 Installing replacing the Battery Pack 24 Storing the Instrument in the C1005 Carrying Case Option 26 Setting the Language and Measurement Line Frequency 50 60 Hz 27 2 3 Pre Operation Inspection 28 2 4 Ins...

Page 4: ... Wiring Wiring Check 54 Chapter 4 Changing Settings __________________________59 4 1 Viewing and Using the Settings Screen 60 4 2 Changing Measurement Settings 61 Measurement 1 Setting Screen 61 Measurement 2 Setting Screen 63 4 3 Changing Recording Save Settings 65 Recording 1 Setting Screen 65 Recording 2 Setting Screen 69 4 4 Changing System Settings as Necessary 71 System 1 Setting Screen 71 S...

Page 5: ...Voltage and Current Waveforms 85 5 8 Enlarging Measured Values on the Display 86 Chapter 6 Starting and Stopping Recording and Measurement ______________________________ 87 6 1 Starting Recording 88 Starting Recording Manually 88 Staring Recording by Specifying a Time 89 Starting Recording at a Good Time Division Interval Time 90 6 2 Stopping Recording 91 Stopping Recording Manually 91 Stopping Re...

Page 6: ...ing the SD Memory Card or Internal Memory 111 Chapter 9 Analyzing Data on a Computer _______________113 9 1 Copying Data to a Computer SD 114 9 2 SF1001 Power Logger Viewer Optional 116 9 3 Checking Recording and Measurement Data with Excel 117 Opening recording and measurement data 117 Saving Data as an Excel File 118 Example of Data from a Measurement File 119 Measurement File Contents 120 Conve...

Page 7: ...PW3360 and a Computer 144 Disconnecting the Instrument from the Computer 146 10 7 Remote Control of the Instrument by Internet Browser 147 Operating the Instrument Remotely 149 Setting a Password 150 If You Forget Your Password 150 Chapter 11 Using Pulse Input and Output _______________ 151 11 1 Connecting Wires to the Pulse I O Terminals 152 11 2 Configuring Pulse Settings 153 11 3 Inputting a Pu...

Page 8: ...pter 13 Maintenance and Service ___________________191 13 1 Trouble Shooting 191 Before Having the Instrument Repaired 193 13 2 Cleaning 195 13 3 Error Indication 195 13 4 Disposing of the Instrument 200 Appendix____________________________________ A1 Appendix1 How the Instrument Samples Data A1 Appendix2 Three phase 3 wire Measurement A2 Appendix3 Method for Calculating Active Power Accuracy A5 A...

Page 9: ...demarks Windows is a registered trademark of Microsoft Corporation in the United States and or other countries The SD logo is a trademark of SD 3C LLC Excel is a registered trademark of Microsoft Corporation in the United States and other countries Model Numbers In this Instruction Manual PW3360 is used as the instrument model Introduction Model No Operation panel PW3360 10 Japanese PW3360 20 Engl...

Page 10: ...firming Package Contents Model PW3360 Clamp on Power Logger 1 Model L9438 53 Voltage Cord 1 Set Alligator Clip 4 red yellow blue and black one each Banana banana leads 4 red yellow blue and black one each Spiral tubes 5 for banding the cords See Bundle the Voltage Cord Leads with the Spiral Tubes p 22 3 3 Connecting the Voltage Cords p 45 Model Z1006 AC Adapter includes power cord 1 USB Cable 1 In...

Page 11: ...Sensor 5000 A rms rated Model 9657 10 Clamp on Leak Sensor Model 9675 Clamp on Leak Sensor Model 9290 10 Clamp on Adapter For voltage measurement Model 9804 01 Magnet Adapter Red 1 for changing the voltage cord tips Model 9804 02 Magnet Adapter Black 1 for changing the voltage cord tips Power supply Model PW9003 Voltage Line Power Adapter for supplying power from measurement lines Model PW9002 Bat...

Page 12: ...way not described in this manual may negate the provided safety features Be certain that you understand the instructions and precau tions in the manual before use We disclaim any responsibil ity for accidents or injuries not resulting directly from instrument defects In the manual the symbol indicates particularly important information that the user should read before using the instru ment The sym...

Page 13: ...ocation of reference information Indicates the prohibited action Indicates that descriptive information is provided below Windows Unless otherwise specified Windows represents Windows XP Windows Vista 32bit or Windows 7 32bit 64bit Names of settings buttons and other screen elements are enclosed in brackets Dialog Dialog box represents a Windows dialog box WEEE marking This symbol indicates that t...

Page 14: ... and must be carefully avoided f s maximum display value or scale length The maximum displayable value or scale length This is usually the name of the currently selected range rdg reading or displayed value The value currently being measured and indicated on the measuring instrument dgt resolution The smallest displayable unit on a digital measuring instrument i e the input value that causes the d...

Page 15: ... battery power 0 C to 40 C 32 F to 104 F When charging the battery 10 C to 40 C 50 F to 104 F When sending or receiving data over a LAN 0 C to 50 C 32 F to 122 F Operating Precautions Before using the instrument verify that damage to any of the voltage cords insulation has not revealed the white insula tor part of the cord or its metallic conductor Cord damage may result in electric shock Replace ...

Page 16: ...ial measures to reduce electromagnetic emissions to prevent inter ference to the reception of radio and television broadcasts To avoid short circuits and potentially life threatening haz ards never attach the clamp to a circuit that operates at more than maximum rated voltage to earth or over bare conduc tors Be careful to avoid dropping the clamps or otherwise subjecting them to mechanical shock ...

Page 17: ... together with a spiral tube p 22 Wrap the color spiral tubes around the clamp sensor cables p 23 Grouping together clamp cables p 23 Install the battery pack p 24 Setting the language and measurement line frequency p 27 Pre Operation Inspection p 28 Inserting an SD memory card p 29 Supplying power p 32 Connecting to measurement lines p 49 p 50 Setting measurement conditions on the Wiring Diagram ...

Page 18: ...urement lines Save destination Save interval Save items Change the settings of measure ment calculation selection sys tem and interface when required MEAS LIST screen Folder File name Recording start Recording stop Clock Measurement is complete Analyzing data on a computer p 113 Viewing measurement data p 77 Recording settings p 65 ...

Page 19: ...to be used even by beginners by enabling them to configure basic settings wirings recording settings and the start of recording through a series of steps The PW3360 Clamp on Power Logger supports extended data acquisition and auto mated measurement thanks to the use of the SD memory card and USB LAN inter face This makes the PW3360 Clamp on Power Logger suitable for power measurement at commercial...

Page 20: ...er Adapter p 34 Ability to operate for about 8 hours on battery power Even when AC power is unavailable the optional battery pack can be used to enable about eight hours of measurement See Installing replacing the Battery Pack p 24 Corresponding to the various power line The instrument can perform single phase 2 wire up to three circuits single phase 3 wire 3 phase 3 wire 2 power measurement 3 pow...

Page 21: ...high capacity 2 GB SD memory card the instrument can record data continuously for up to one year Communications functionality Instrument settings and data can be downloaded via the instrument s USB and LAN interfaces See Chapter 10 Using Communications USB LAN p 129 Pulse I O Pulse input counts a pulse signal from an external source and saves the result at a constant interval Unit consumption mana...

Page 22: ... Displays the File SD memory card internal mem ory screen and switches screens p 97 Wiring key Displays the Wiring Diagram Wiring Check screen and switches screens p 39 Quick Set key Displays the Quick Set screen and switches to the next screen p 93 Measurement guide Cursor keys Moves the cursor on the screen The cursor keys are also used to scroll graphs and waveforms Enter key Selects items on t...

Page 23: ...interface Connect a computer here using the included USB cable See p 130 AC adapter hook Loop the AC adapter cord through this hook See p 32 Power switch Turns the instrument on and off See p 37 AC adapter connection jack See p 32 Pulse I O terminal Pulse input Counts pulse input from an external source Pulse output Generates pulse output based on integrated energy values See p 151 Charge LED Ligh...

Page 24: ...nection Do not remove the label as the infor mation it contains is necessary in order to manage the device Serial number Displays the instrument s serial num ber Do not remove the label as the information is contains is necessary in order to manage the device Battery protector Remove when using the battery Connect the PW9002 Battery Set including the 9459 Battery Pack and a battery case and reatta...

Page 25: ...apter 1 Overview 1 4 Screen Configuration Measurement screen LIST POWER INTEG WAVE ZOOM U I Setting screen MEAS 1 REC 1 REC 2 SYS 1 SYS 2 PULSE MEAS 2 LAN See Chapter 5 Viewing Measurement Data p 77 See Chapter 4 Changing Settings p 59 ...

Page 26: ... Wiring Check See Chapter 3 Connecting to Lines to be Measured p 39 File Screen SD card Memory See Chapter 8 Saving Data and Manipulating Files p 97 Quick Set Screen Quick Set Start See Chapter 7 Quick Set p 93 Measurement Guide published separately in color ...

Page 27: ...internal memory is being accessed Indicates that data is being sent or received over the LAN p 144 Indicates that data is being sent or received by the HTTP server function p 147 Indicates that data is being sent or received both over and LAN and by the HTTP server Indicates that data is being sent or received by the USB interface Indicates that recording and measurement are in progress Indicates ...

Page 28: ... If the current is over range increase the current range Indicates that measurement is not possible Power factor cannot be measured when there is no input Lights up when the PW3360 is being operated using the AC adapter p 32 Lights up when the PW3360 is being operated on battery power p 24 Lights up when the PW3360 is being operated on battery power and there is inadequate battery life remaining C...

Page 29: ...cribed below to prepare for measurement Measurement Preparations Chapter 2 2 1 Preparation Flowchart At purchase At purchase Wrap the color spiral tubes around the clamp sensor cables p 23 2 Connect the AC adapter p 32 Insert an SD memory card p 29 6 7 3 8 Secure the voltage cords to gether with a spiral tube p 22 1 At purchase Install the battery pack p 24 Turn on the instrument p 37 Perform the ...

Page 30: ...e 3 wire 3P3W3M Three cords red yellow and blue 3 phase 4 wire 3P4W Four cords black red yellow and blue Model L9438 53 Voltage Cord Banana Plug Leads three one each black red and yellow Alligator Clips three one each black red and yellow Five Spiral Tubes for cable bundling 1 Line up the ends of the voltage cords and wrap the spiral tube around them Wind a Spiral Tube round the multiple cords Fiv...

Page 31: ...ral Tubes around Clamp Sensors and Grouping Together Cables Four color spiral tubes For color coding clamp sensors Two clamp sensors in use Red thin Yellow thin Five spiral tubes For grouping together cords Model 9661 Black thick 1 Wrap spiral tubes of the same color around the connector and sensor sides of the clamp sen sor cable CH1 Red tubes CH2 Yellow tubes CH3 Blue tubes 2 Group together mult...

Page 32: ...replacing the Battery Pack For battery operation use only the HIOKI Model PW9002 Battery Set We do not take any responsibility for accidents or damage related to the use of any other batteries To avoid the possibility of explosion do not short circuit disassemble or incinerate battery pack Handle and dispose of batteries in accordance with local regulations To avoid electric shock turn off the pow...

Page 33: ...will go 6 With the battery case facing down fit it into the recessed area on the instrument Exercise care not to pinch the battery pack s wires between the battery case and the instrument 7 Place the protector over the bat tery case Pushing down on the entire protector so that the pro tector and battery case fit snugly together tighten the screws with the screwdriver 8 Connect the AC adapter to th...

Page 34: ...1005 Carrying Case as follows Storing the Instrument in the C1005 Carrying Case Option Model PW3360 instrument This divider is attached by means of Velcro style fasteners and can be removed It can be arranged as desired to accommodate the case s contents Voltage cords Accessories and options ...

Page 35: ...nd frequency have been set these setting screens will no longer be displayed when the instrument is powered on The settings can be changed at any time on the Settings screen See Language setting System 1 Setting Screen p 71 See Frequency setting Measurement 1 Setting Screen p 61 1 Turn on the power switch The Language Setting screen will be displayed 2 Select the desired language with the function...

Page 36: ...age cords Is the insulation of the voltage cord to be used damaged or is bare metal exposed 1 Do not use if damage is present as you could re ceive an electric shock Contact your authorized Hioki distributor or reseller if you find any damage 2 Inspect the clamp sensors Is a clamp cracked or damaged Is the cable s insulation damaged 3 Inspect the AC adapter Is damage to the AC adapter evident Is t...

Page 37: ... down backwards or in the wrong direction may damage the instrument Some SD memory cards are susceptible to static electricity Exercise care when using such products because static electric ity could damage the SD memory card or cause malfunction of the instrument Important Use only HIOKI approved SD memory cards Other SD memory cards may not work with the instrument and Hioki is unable to guarant...

Page 38: ...r shock and do not turn the power off or remove the card from the instru ment 3 Before formatting initializing a card confirm that it contains no important information files 4 Do not bend or drop the card or otherwise subject it to intense shock The SD memory card s connector is used to judge whether the card is write protected If the write protected lock is in an inter mediate position the determ...

Page 39: ...facing up insert it into the slot in the direction shown by the arrow and push it all the way in Keep the card level as you insert it Inserting it at an angle may cause the write protect lock to engage preventing data from being written to the card 5 Close the SD memory card slot cover Be sure to close the cover Format new SD memory cards before use See Formatting the SD Memory Card or Internal Me...

Page 40: ... damaging the power cord grasp the plug not the cord when unplugging it from the power outlet Make sure the power is turned off before connecting or discon necting the AC adapter When using a 250 V power cord for example with a version of the instrument sold in China Australia or the EU it may appear that the power cord cannot be inserted all the way into the AC adapter This is normal As long as t...

Page 41: ...t as follows 1 Turn off the power switch 2 Connect the power cord to the inlet on the AC adapter 3 Connect the AC adapter s output plug to the instrument Once the output plug is connected route the cord underneath the hook to keep it from being pulled out 4 Connect the power cord s input plug to an outlet 2 4 3 Power OFF 1 AC adapter hook ...

Page 42: ...ter Before connecting the instrument to measurement lines verify that the voltage and frequency of the measurement lines being used are 100 to 240 VAC and 50 60 Hz respec tively Use of the instrument outside the specified supply voltage range may result in equipment damage or an electri cal accident The instrument s maximum rated power is 13 VA When using the PW9003 Voltage Line Power Adapter do n...

Page 43: ...odel Z1006 AC Adapter Model PW9003 Voltage Line Power Adapter Insert the plug as far as it will go Although it may appear that the plug has not been inserted all the way this is normal 3 4 5 6 7 PW9003 Z1006 L9438 53 1 9 Power OFF Power ON 2 8 Power OFF Power ON 1 Turn off the instrument s power switch 2 Turn off the PW9003 Voltage Line Power Adapter s power switch 3 Connect the voltage line power...

Page 44: ...apter s power switch 9 Turn on the instrument s power switch Connecting the voltage line power adapter s banana plugs to the instrument s volt age input terminals Wirings Model PW9003 1P2W 1P3W 1P3W1U 3P3W2M 3P4W 3P3W3M Black cord The voltage input N terminal of the PW3360 The voltage input CH2 terminal of the PW3360 Red cord The voltage input CH1 termi nal of the PW3360 The voltage input CH1 term...

Page 45: ... Measurement Guide pub lished separately in color 2 6 Turning the Power On Off Before turning the instrument on make sure the supply volt age matches that indicated on the AC adapter Connection to an improper supply voltage may damage the instrument or AC adapter and present an electrical hazard If the instrument encounters an error during the self test the instrument is damaged Contact your autho...

Page 46: ... test is complete If the instrument fails to turn on when using the AC adapter there may be a break in the power cord or an AC adapter or internal instrument malfunction Contact your authorized Hioki distributor or reseller If an error message is displayed before the self test completes there may be an internal instrument malfunction Contact your authorized Hioki distributor or reseller ...

Page 47: ...ts 1 Do not allow the voltage cord clips to touch two wires at the same time Never touch the edge of the metal clips 2 When the clamp sensor is opened do not allow the metal part of the clamp to touch any exposed metal or to short between two lines and do not use over bare conductors To prevent electrical shock and personnel injury do not touch any input terminals on the VT PT CT or the instru men...

Page 48: ...1 Connection Procedure 1 Wiring diagram screen Set the measurement conditions p 41 3 Attach the clamp sensors p 47 4 Make connections p 49 5 Make connections p 50 2 Attach the voltage cords p 45 6 Wiring Check screen Set the current range p 52 Check the wirings p 54 ...

Page 49: ...ing method clamp sensor and current range settings can be configured on the Measurement screen Settings screen or Wirings screen The CT ratio and VT PT ratio settings if needed can be configured on the Settings screen See 4 2 Changing Measurement Settings p 61 SET 1 8 MEAS 1 screen SET 2 8 MEAS 2 screen MEAS LIST screen 1 Press the key to display the WIR DIAG screen 2 Select the wiring method 1P2W...

Page 50: ...e lines 2 power method Three phase 3 wire measurement is performed from two line to line voltages and two line cur rents U3 is calculated from U1 and U2 and I3 is calculated from I1 and I2 Although the total active power is the same as 3P3W3M 3P3W3M is used when measuring the power of individual phases since that mea surement cannot be performed using 3P3W2M Appendix2 Three phase 3 wire Measuremen...

Page 51: ...ines use the same clamp sensor for channels 1 to 3 When using the CT9667 Flexible Clamp on Sensor use the same value for the sensor range setting and the instrument s clamp sensor range setting When using the 9667 Flexible Clamp on Sensor select the CT9667 The 9657 10 and 9675 leakage current measurement sensors can only be selected when the wiring is set to I only 1P2Wx2 I1 I2 1P2Wx3 I1 I2 I3 1P3...

Page 52: ...gure the current range set ting while checking the current value on the WIR CHK screen after connect ing the instrument See 3 7 Setting the Current Range p 52 9660 5A 10A 50A 100A 9661 5A 10A 50A 100A 500A CT9667 500A CT9667 5k 5kA 9669 100A 200A 1kA 9694 0 5A 1A 5A 10A 50A 9695 02 9695 03 5A 10A 50A 100A 9657 10 50mA 100mA 500mA 1A 5A 9675 ...

Page 53: ...the specified L9438 53 Voltage Cord to connect the instrument volt age input terminals to the circuit to be tested To ensure voltage cord integrity grip cords by the plug when connecting or disconnecting them Voltage cords used by wiring type Measurement target Voltage cord to use color Single phase 2 wire 1P2W Single phase 3 wire 1P3W1U Two cords black and red Single phase 3 wire 1P3W 3 phase 3 w...

Page 54: ...cords connection 1 Attach the alligator clip or magnet adapter to the end of the voltage cord 2 Insert the voltage cords into the voltage input terminals while checking the WIR DIAG screen Magnet adapter or Alligator clip Insert plugs all the way in ...

Page 55: ...cation details and usage procedures 3 4 Connecting a Clamp Sensors When disconnecting the BNC connector be sure to release the lock before pulling off the connector Forcibly pulling the connector without releasing the lock or pulling on the cable can damage the connector Measurement target Clamp sensors CH spiral tube color Single phase 2 wire 1P2W one CH1 red Single phase 3 wire 1P3W two CH1 red ...

Page 56: ...lign the groove on the BNC connector with the connector guide on the instru ment and push it into place 2 Turn the connector clockwise to lock it in place To disconnect the connector turn it coun terclockwise to unlock it and then pull PW3360 current input terminal Connector aligning Current input terminals BNC connector of the clamp sensor Lock ...

Page 57: ...part of the screw or wiring bar on the secondary side of the circuit break er Secondary side of breaker Model 9804 01 9804 02 Magnet Adapter Model L9438 53 Voltage Cord Connect the magnetic part of the 9804 01 or 9804 02 tip to the screws on the sec ondary side of the breaker Secondary side of breaker Model 9804 01 9804 02 Magnet Adapter Model L9438 53 Voltage Cord The weight of the voltage cords ...

Page 58: ...ped together will not produce any reading 3 6 Connecting Clamp Sensors to Lines to be Measured Note that the clamp sensor may be damaged if the applied current exceeds the maximum input current For more information about clamp sensor specifications see the instruction manual that came with the clamp sensor Load Current Measurement Line Load side Source side Line Load side Current Flow Direction Ar...

Page 59: ...re Place the clamp around two wires single phase 3 wire Place the clamp around three wires 3 phase 3 wire Place the clamp around three wires 3 phase 4 wire Place the clamp around four wires Grounding wire Place the clamp around one wire Current direction arrow in the direction as shown Example Load Device Current Flow Direction B type grounding wire ...

Page 60: ...an appropriate current range as follows 3 7 Setting the Current Range 1 Press the key to display the WIR CHK screen 2 Press CIRCUIT to switch circuits When measuring multiple single phase 2 wire 1P2W circuits or when current only is selected you can set a different range for each circuit ...

Page 61: ...too low you will experience an over range event during measure ment making accurate measurement impossible Conversely if the range is too high the error will be too large making accurate measurement impossible Set the current range based on the maximum load current that is anticipated during the measurement interval 9660 5A 10A 50A 100A 9661 5A 10A 50A 100A 500A CT9667 500A CT9667 5k 5kA 9669 100A...

Page 62: ...ge and current fundamental wave phase angle measured value See 5 4 Viewing Voltage and Current Value Details RMS Values Funda mental Wave Values Peak Values and Phase Angles p 81 3 If you have selected a 1P2W 2 or 3 circuits You can change the circuit with CIRCUIT Result Green PASS Red FAIL Yellow CHECK The power factor is displayed as DPF displacement power factor on the Con nection Confirmation ...

Page 63: ...hat has been tagged as red FAIL or yellow CHECK and press the ENTER key A dialog box with helpful information for fixing the wiring will be displayed Re view its content 6 Press the key to close the dialog box Review similar information for other wiring confirmation items as necessary 7 Press the key to display the WIR DIAG screen and check the actual wirings against the diagram shown on the scree...

Page 64: ...iring Check cannot be performed Operate the equipment and keep current flowing in order to check the wiring If the equipment cannot be operated a proper Wiring Check cannot be con ducted Visually check for proper wiring before measuring Are the clamp on sensors properly inserted into the current input terminals Are the clamp on sensors clamped cor rectly Is the set current range too large for the ...

Page 65: ...eed if OK When phase advances too much due to phase advancer in light loads PF may be low and phase diff may be large Check wiring for problems and proceed if OK See 3 3 Connecting the Voltage Cords p 45 to 3 6 Connecting Clamp Sen sors to Lines to be Measured p 50 Power factor CHECK will display if the power factor of the line to be measured is less than 0 5 Are the clamp on sensors clamped cor r...

Page 66: ...3 8 Verifying Correct Wiring Wiring Check 58 ...

Page 67: ...59 3 Chapter 4 Changing Settings 4 You can change any setting item on the setting screen See 10 5 LAN Communications p 138 See 11 2 Configuring Pulse Settings p 153 Changing Settings Chapter 4 ...

Page 68: ...rom a list Enter Allows you to switch to the Settings screen and change the Setting screen Saves settings data See 8 4 Saving Settings Files p 106 Accept the selection Select an item Select an item Display a pull down menu Accept the value Select an item Make it editable Increase the value by 1 Decrease the value by 1 Changing a value Move to the desired digit Changing an item Enter Enter Enter En...

Page 69: ...ttings screens Wiring Selects the measurement line wiring method See Selecting the wiring method p 42 Frequency Selects the frequency Use of an improper frequency setting will prevent accurate measurement Be sure to set the frequency to the measurement line frequency 4 2 Changing Measurement Settings Measurement 1 Setting Screen Selection 50Hz 60 Hz ...

Page 70: ...cy Setting Error dialog box will be displayed if the instrument detects voltage input and determines that the fre quency differs from the set frequency Press the ENTER key and change the frequency settings Selection Manual 0 01 to 9999 99 Select 1 40 60 80 120 160 200 240 300 400 600 800 1200 When taking measurements on the secondary side of a current transformer CT you can set the CT ratio in ord...

Page 71: ...00 600 700 1000 2000 2500 5000 When taking measurements on the secondary side of a voltage transformer VT you can set the VT ratio in order to convert the readings to their primary side equivalents and display the results For a VT with a primary side voltage of 6 6 kV and a sec ondary side voltage of 110 V the VT ratio would be 60 6 600 V 110 V Since the current range is fixed at 600 V it would be...

Page 72: ...eactive power and apparent power Power factor PF RMS power factor Reactive power Q calculated from RMS values Apparent power S calculated from RMS values Fundamental wave calculation Uses voltage and the current fundamental wave to calcu late the power factor reactive power and apparent power Power factor DPF displacement power factor Reactive power Q fundamental wave reactive power Apparent power...

Page 73: ...hanging Recording Save Settings Recording 1 Setting Screen Selection SD card Saves data on the SD memory card If no SD memory card is inserted data will be saved in the instrument s internal memory Internal memory Saves data in the instrument s internal memory capacity approximately 320 KB Selection 1 sec 2 sec 5 sec 10 sec 15 sec 30 sec 1 min 2 min 5 min 10 min 15 min 20 min 30 min 60 min Data st...

Page 74: ...es Maximum To check maximum values for current power etc Minimum To check minimum values for voltage power factor etc Because the voltage and current peak values are not average values peak values will not be output when Average only is selected To check peak values select All data When a Current only connection is being used average values are not used for the current fundamental wave phase angle...

Page 75: ...rement is repeated without changing the folder name a number will be auto matically appended to the folder and file name Folder filename folder sequential number 2 digits AUTO Automatically appends a number in the format YYMMD DXX The first six characters consist of the date and subsequent numbers consist of a sequential number The maximum file size for measurement data is 200 MB approxi mately Wh...

Page 76: ...AUTO 3 If you selected MANUAL A dialog box for inputting the folder and file name will be displayed Select one character at a time with the cursor keys and then accept the entered name with the ENTER key 4 Once you have entered the folder filename accept it with the OK key Pressing Cancel will cancel the entered folder filename ...

Page 77: ...ed at the set time YY MM DD hh mm If the set time has already passed the interval time starting method is used INTERVAL Starts recording at an even division after the interval time elapses Example If the START STOP key is pressed at 10 41 22 with the save interval set to 30 minutes the instrument will enter the standby state and recording will start at 11 00 00 Similarly if the save interval is se...

Page 78: ...ble to change the setting 3 Change the setting with the cursor keys and then accept the new value with the ENTER key Change other settings as necessary Selection MANUAL Stops recording when the START STOP key is pressed TIME Selecting TIME causes a dialog box for setting the time to be displayed Recording is stopped at the set time YY MM DD hh mm If the set time has already passed when recording i...

Page 79: ...ess beep on and off LCD backlight Selects whether to automatically turn off the LCD backlight 4 4 Changing System Settings as Necessary System 1 Setting Screen The seconds cannot be set After changing the time pressing the Enter key causes the seconds to be reset to 00 Selection ON OFF Selection AUTO OFF Automatically turns off the backlight once two minutes have elapsed since the last key operati...

Page 80: ...d on the WIR DIAG screen Screen color Selects the screen color Language Selects the display language The Chinese display is available in version 2 00 provisional and later Selection R S T A B C L1 L2 L3 U V W Selection COLOR 1 to 3 Selection JAPANESE Selects the Japanese display ENGLISH Selects the English display ...

Page 81: ...nformation Displays the instrument s serial number and software and FPGA versions System 2 Setting Screen Selection OFF Display the Measurement screen instead of displaying the Quick Set start dialog box when the instrument is turned on The Quick Set can be displayed by pressing the Quict Set key even when this option is set to OFF ON Displays the Quick Set start dialog box when the instru ment is...

Page 82: ...cause of the problem remains unclear try a system reset Performing a system reset causes all settings other than the frequency setting clock language setting IP address subnet mask and default gateway to be initial ized to their default values The instrument s internal memory will not be erased 4 5 Initializing the Instrument System Reset Select Enter ...

Page 83: ...strument s internal memory will be erased Reverting the Instrument to Its Factory Settings Factory Reset 1 Turn off the power switch 2 Turn on the instrument while holding down the ENTER and keys and continue hold ing them down until the beep sounds after the self test is com plete 3 The instrument will be reset to its factory settings and the Lan guage Setting screen will be dis played See Settin...

Page 84: ...nterval 5 minutes Save Items AVG only Screen Save Off Folder File Name Auto REC 2 Recording start method Interval Recording stop method Manual SYS 1 Clock Set at time of shipment BEEP Sound On LCD Backlight Auto Off Phase Name RST Display color Color 1 Language Not set Select Japanese or English when the instrument is powered on for the first time SYS 2 Start Quick Set at power on Off LAN IP Addre...

Page 85: ...rement Screen Holds measured values While values are being held the HOLD indicator will turn red Allows you to select a Measurement screen Selects a screen name from a list Enter Switches to the Measurement screen and changes the Mea surement screen Current channel Current range Clamp sensor If a setting is changed while measured values are being held the hold will be canceled The time display is ...

Page 86: ...s select the circuit 1P2W x 2 or 1P2W x 3 Wiring Changes the circuit For 1P2W x 2 or 1P2W x 3 wirings you must change the circuit since the MEAS LIST and MEAS POWER screens vary with the circuit The circuit number and current channel dis plays will change Selects the circuit ...

Page 87: ...pk voltage funda mental wave phase angle Udeg current RMS I current fundamental wave value Ifnd current waveform peak Ipeak or Ipk and current fundamental wave phase angle Ideg 5 4 p 81 Power Per channel and total active power P apparent power S reactive power Q power factor PF or displacement power factor DPF 5 5 p 82 Integ Active energy consumption WP regeneration WP reactive energy lag WQ lead ...

Page 88: ...n 5 3 Viewing Data Voltage Current Power and Energy as a List Frequency Voltage RMS Current RMS Apparent power Selects between power factor PF RMS calculation and displace ment power factor DPF fundamen tal wave calculation with settings See PF Q S calculation p 64 Active power Reactive power Active energy consumption ...

Page 89: ...for fundamental Peak value The maximum value of the absolute values of the sampling points 1 024 points in a 200 ms interval Fundamental wave phase angle PHASE The phase angle of the fundamental wave component of U1 expressed in terms of 0 For current only the fundamental wave phase angle of I1 expressed in terms of 0 For 3P3W3M wirings the line to line voltage is used for RMS cal culations and th...

Page 90: ...ificance However values for individual channels can serve as reference data when checking the connection If you wish to check the balance of power values for individual channels on a 3 phase 3 wire circuit use the 3 phase 3 wire 3 wattmeter method 3P3W3M See Appendix2 Three phase 3 wire Measurement p A2 5 5 Viewing Power Details Channel Power Values Per channel reactive power Per channel active po...

Page 91: ...gy and Reactive Energy 83 Chapter 5 Viewing Measurement Data 5 Press the or SCREEN key to display the MEAS INTEG screen 5 6 Viewing Energy Active Energy and Reac tive Energy Total energy from the start of recording will be displayed ...

Page 92: ... waveforms U1 Red U2 Yellow U3 Blue Voltage vertical axis Voltage value for 1 division Changes the zoom factor for the vertical axis used to display voltage and current waveforms p 84 Voltage RMS Current RMS Current waveforms I1 Red I2 Yellow I3 Blue Current vertical axis Current value for 1 division Frequency ...

Page 93: ...oom factor and press the ENTER key A dialog box for selecting the zoom factor will be displayed 3 Select the desired zoom factor with the cursor s keys and press the ENTER key For 1P2W x 2 or 1P2W x 3 wirings changes to the vertical axis zoom factor will affect all channels even if individual channels use different clamp sensors or current ranges For 3P3W3M wirings the phase voltage from the virtu...

Page 94: ...meter field and you will be able to change the setting 2 Using the cursor keys move to the parameter whose enlarged display you wish to change and press the ENTER key A dialog box for selecting the en larged display will be displayed 3 Select the desired parameter with the cursor keys and accept the new setting with the ENTER key Change other parameters similarly 4 Press the SELECT key to cancel t...

Page 95: ...nging Recording Save Settings p 65 Starting and Stopping Recording and Measurement Chapter 6 MANUAL TIME INTERVAL Recording start method Starts recording when the Start Stop key is pressed Starts recording when the specified time is reached Starts recording at an even division based on the save interval time MANUAL TIME Recording stop method Stops recording when the Start Stop key is pressed Stops...

Page 96: ...e card is reinserted Similarly when the recording measurement data file exceeds 200 MB in size the file will be segmented and data will be saved in a new file with a sequentially numbered suffix See 8 2 Folder and File Structure p 100 Starting Recording Manually 1 Set the recording start method on the SET 4 8 REC 2 screen to MAN UAL 2 Press the key on the Measurement screen Recording will start an...

Page 97: ...n the SET 4 8 REC 2 screen to TIME and set the start time 2 Press the key The instrument will enter the standby state 3 When the set start time is reached recording will start and the RECORDING LED will light up The recording LED On If the recording start time has already passed when the Start Stop key is pressed the interval time starting method will be used ...

Page 98: ...strument will enter the standby state 3 Recording will start automatically when a good time division is reached based on the save interval time Example If the Start Stop key is pressed at 11 22 23 with the interval save time set to 5 min utes the instrument will start recording at 11 25 00 The recording LED On If the save interval is set to 30 seconds or less recording will start from the next 00 ...

Page 99: ... Stopping Recording Stopping Recording Manually 1 Set the recording stop method on the SET 4 8 REC 2 screen to MAN UAL 2 Press the key on the Mea surement screen A confirmation dialog box will be displayed 3 Press the ENTER key to stop recording The maximum recording and measurement period is one year Recording will stop automatically after one year Stopping Recording by Specifying a Time If the r...

Page 100: ...del 9459 Battery Pack has been installed the instrument will automatically switch to battery power in the event of a power outage and continue recording 6 3 Operation When a Power Outage Occurs While Recording If the supply of power to the instrument is cut off while accessing the SD memory card files on the card may be corrupted Since the SD memory card is accessed frequently when recording with ...

Page 101: ...et configure all settings as desired See Measurement Flowchart p 9 See Chapter 4 Changing Settings p 59 The settings listed below can be configured with the Quick Set To configure other settings exit the Quick Set without starting recording after proceeding to Quick Set 8 8 Start and add the desired settings See 7 2 Settings That Can Be Added to Quick Set Settings p 94 Quick Set Chapter 7 7 1 Sett...

Page 102: ...ording and measurement as desired 7 2 Settings That Can Be Added to Quick Set Settings 1 Press the key to start the Quick Set 2 Following the instructions given by the Quick Set proceed to the Quick Set 58 8 START screen 3 Without starting recording press the STOP QS key to exit the Quick Set The settings configured with the Quick Set up to this point will be saved ...

Page 103: ... configure the necessary settings on the Set tings screen See 4 2 Changing Measurement Settings p 61 5 Reconfirm the wirings and measured values See 3 8 Verifying Correct Wiring Wiring Check p 54 See Chapter 5 Viewing Measure ment Data p 77 6 Press the key on the Measurement screen to start recording ...

Page 104: ...7 2 Settings That Can Be Added to Quick Set Settings 96 ...

Page 105: ...form operations such as loading settings data deleting folders and files and formatting the SD memory card or internal memory Saving Data and Manipulating Files Chapter 8 File contents Extension Format SD memory card Internal memory Recording and measurement data CSV CSV Available Available Screen copy BMP BMP Available Not available Setting SET Text Available Available ...

Page 106: ... the order in the save area on the SD memory card Move within the folder hierarchy select folders and files Move up and down or Folder File Function keys Reference USB Drive 10 1 Copying Data to a Computer USB p 130 SET LOAD 8 5 Loading Settings Files p 107 DELETE 8 7 Deleting Folders and Files p 110 FORMAT 8 8 Formatting the SD Memory Card or Internal Memory p 111 The File screen can display fold...

Page 107: ...mory When you scroll the screen with the cursor keys the scroll bar indicates your current position Displays a folder and file list The list order reflects the order in the save area on the internal memory Function keys Reference COPY 8 6 Copying Internal Memory Files to the SD Mem ory Card p 109 SET LOAD 8 5 Loading Settings Files p 107 DELETE 8 7 Deleting Folders and Files p 110 FORMAT 8 8 Forma...

Page 108: ...he PW3360 base folder does not ex ist on the card a dialog box asking whether you wish to create it will be dis played 2 Accept with the ENTER key The PW3360 base folder includ ing screen copy and settings fold ers will be created in the root folder on the SD memory card Screen copy folder PW3360 base folder SD memory card root folder PW3360 SETTING HARDCOPY SD Settings folder Even if you choose N...

Page 109: ...d measurement folder and file structure p 103 Recording and measurement data folder manual folder and file naming YYMMDD Recording and measurement start date 00 Sequential number 00 to 99 See Recording and measurement folder and file structure p 102 Files copied from internal memory The MEMORY folder does not exist by default It is created when files are copied from internal memo ry to the SD memo...

Page 110: ...Recording and measurement data Recording and measurement data files A new file is added when the cur rent file exceeds 200 MB up to 100 files MMDDhhmm BMP MMDDhhmm BMP MMDDhhmm BMP When saving of screen copies is OFF this folder will not be created MMDDhhmm Output time and date Screen copy files Automatic screen copy folder YYMMDD00 SET MMDD0000 CSV MMDD0001 CSV MMDD0002 CSV Recording data file Se...

Page 111: ... Screen copy files Automatic screen copy folder Recording and measurement data files A new file is added when the cur rent file exceeds 200 MB up to 100 files Filenames Recording and measurement data folder name up to 5 characters from the name of the settings folder folder sequential number 0 to 99 file sequential number 00 to 99 If recording and measurement are repeated without manually chang in...

Page 112: ...nal Memory Manual folder and file naming setting for ex ample HIOKI Internal memory root folder Setting file SET Recording and measurement file CSV 60SETXX SET 60MEMXX CSV HIOKI CSV HIOKIXX CSV 60BACKXX CSV XX 00 to 99 Automatic folder and file naming setting If recording is stopped and then restarted using the manual HIOKI setting Data that was backed up in the internal memory because no SD memor...

Page 113: ...to Internal M screen copies are saved on the SD memory card If no SD memory card has been inserted screen copies cannot be saved 1 Verify that an SD memory card has been inserted into the instrument 2 Display the screen you wish to save and press the key You can save a hold screen by pressing the HOLD key The screen will be saved in the PW3360 HARDCOPY folder in the SD memory card s root folder at...

Page 114: ...her SD memory card or internal memory 2 Press the SET SAVE key on the Settings screen Save destination Settings file save location SD memory card Files are saved in the PW3360 SETTINGS folder in the SD memory card s root folder at the top of the card s folder hierarchy See 8 2 Folder and File Structure p 100 Internal memory Files are saved in the root folder at the top of the internal memory s fol...

Page 115: ...AN settings are not loaded SD Memory Card 1 Press the key to display the FILE SD screen 2 Select the settings file with the SET extension to load Move within the folder hierarchy Move up and down Select folders and files Settings files saved using the functional ity provided by the instrument for saving settings can be found in the PW3360 SETTING folder 3 Press the SET LOAD key 4 When the confirma...

Page 116: ...al Memory 1 Press the key to display the FILE Memory screen 2 Select the settings file with the SET extension to load Move up and down select a file 3 Press the SET LOAD key 4 When the confirmation dialog box is displayed press the YES key ...

Page 117: ...ory card 8 6 Copying Internal Memory Files to the SD Memory Card 1 Press the key to display the FILE Memory screen 2 Select the file to copy to the SD memory card 3 Press the COPY key 4 When the confirmation dialog box is displayed press the ENTER key The file will be saved in the PW3360 MEMORY folder in the SD memory card s root folder at the top of the card s folder hierarchy ...

Page 118: ...8 7 Deleting Folders and Files 1 Press the key to display the FILE SD or FILE Memory screen 2 Select the folder or file to delete Move within the folder hierarchy SD memory card only Move up and down Select folders and files 3 Press the DELETE key A confirmation dialog box will be dis played 4 Accept with the ENTER key or The PW3360 folder cannot be deleted ...

Page 119: ...rs will be automatically cre ated in the root folder of the card Screen copy folder PW3360 base folder SD memory card root folder PW3360 SETTING HARDCOPY SD Settings folder Formatting will cause all saved data to be erased and it cannot be undone Check the contents of the card or memory before for matting It is recommended to back up important data on SD memory cards and in the instrument s intern...

Page 120: ...8 8 Formatting the SD Memory Card or Internal Memory 112 ...

Page 121: ...r with an SD memory card reader or download it from the SD memory card or the instrument s internal memory to a computer using the instrument s USB or LAN functionality See Chapter 10 Using Communications USB LAN p 129 Analyzing Data on a Computer Chapter 9 Model SF1001 Power Logger Viewer Recording data File content Extension Format Supported application software Model SF1001 supported Other than...

Page 122: ...ent data from the SD memory card or the instru ment s internal memory to a computer using the instrument s USB or LAN function ality See Chapter 10 Using Communications USB LAN p 129 Windows7 9 1 Copying Data to a Computer SD 1 Verify that recording and measure ment have stopped Removing a card while data is being written to it may damage the card 2 Eject the SD memory card from the instru ment 3 ...

Page 123: ...ta on a Computer 9 4 Click the Start Computer 5 Double click the PW3360SD If the SD card was not formatted with instrument Removable Disk will be dis played 6 Copy the necessary folders or files to the specified folder on the computer 2 Click 1 Click Double click ...

Page 124: ...he following capabilities 9 2 SF1001 Power Logger Viewer Optional Displaying a time series graph 2 axis display Select parameters and display a time series graph Displaying a ledger style list Select parameters and display a time series data Displaying settings You can load settings data contained in mea surement data and review the setting condi tions that were used at the time of measurement Pri...

Page 125: ...ng recording and measurement data 1 Copy data saved on the SD memory card or in the instrument s internal mem ory to a computer See 9 1 Copying Data to a Computer SD p 114 See 10 1 Copying Data to a Computer USB p 130 2 Double click on the recording and measurement data file that you copied to the computer 3 The recording and measurement data file will open allowing you to review the data When the...

Page 126: ...le the file format will change When you open a measurement CSV format file save it as an Excel file xlsx Saving Data as an Excel File 1 Click file Save As on the menu bar 2 Specify the save destination The file can be saved anywhere you wish 3 Select Microsoft Office Excel Workbook under Save as type 4 Change the filename as necessary and click Save Click Click ...

Page 127: ...ement Data with Excel 119 3 Chapter 9 Analyzing Data on a Computer 9 An example of data from a measurement file is shown below Example of Data from a Measurement File Instrument information Measurement information Measurement data Rec ...

Page 128: ...ulation selection RMS FND Power factor PF reactive power Q apparent power S calculation selection RMS RMS calcula tion FND Fundamental wave calculation FREQUENCY Frequency 50Hz 60Hz Frequency setting THD THD Total harmonic distortion Calcula tion selection Support planned in Ver 2 00 and later INTERVAL Save interval time 1sec 2sec 5sec 10sec 15sec 30sec 1min 2min 5min 10min 15min 20min 30min 60min...

Page 129: ...600 800 1200 CT ratio setting If there are multiple circuits the ratio for each is included PULSE Pulse input unit User specified ABCDE 5 characters Pulse input unit set ting Parameter Parameter name Format Description Parameter Parameter name Format Description Date Output time and date YYYY MM DD hh mm ss Output time and date Etime Elapsed time hhhh mm ss Elapsed time from start of recording Sta...

Page 130: ... p A81 Ufnd2_xxx V U2 CH2 Ufnd3_xxx V U3 CH3 Ufnd12_xxx V U12 CH12 For 3P3W2M wirings value for third channel as calculated from U1 and U2 Upeak1_xxx V Peak value of the voltage waveform Absolute value U1 CH1 See 5 4 Viewing Voltage and Current Value Details RMS Val ues Fundamental Wave Values Peak Values and Phase Angles p A81 Upeak2_xxx V U2 CH2 Upeak3_xxx V U3 CH3 Upeak12_xxx V U12 CH12 For 3P3...

Page 131: ...ed from I1 and I2 Ipeak1_xxx A Peak value of the current waveform Absolute value I1 CH1 See 5 4 Viewing Voltage and Current Value Details RMS Val ues Fundamental Wave Values Peak Values and Phase Angles p 81 Ipeak2_xxx A I2 CH2 Ipeak3_xxx A I3 CH3 Ipeak12_xxx A I12 CH12 For 3P3W2M connections value for third channel as calculated from I1 and I2 Ideg1_xxx deg Current fundamental phase angle I1 CH1 ...

Page 132: ...ra tion WP 1 Wh to WP 3 Wh Active energy Regeneration first cir cuit to third circuit Active energy Regeneration for each of three 1P2W circuits WQLAG varh Reactive energy Lag Reactive energy from start of recording Lag WQLAG1 varh to WQLAG3 varh Reactive energy Lag first circuit to third circuit Reactive energy Lag for each of three 1P2W circuits WQLEAD varh Reactive energy Lead Reactive energy f...

Page 133: ...ive power demand value Con sumption Average value of active power Consumption for each interval time Pdem 1 W to Pdem 3 W Active power demand value Con sumption first circuit to third circuit Active power demand value Con sumption for each of three 1P2W cir cuits Pdem W Active power demand value Regen eration Average value of active power Regeneration for each time interval Pdem 1 W to Pdem 3 W Ac...

Page 134: ...ption 2 2 demLAG Pdem Pdem Q For average value data Avg is shown as xxx For maximum value data Max is shown as xxx For minimum value data Min is shown as xxx Units are shown in brackets after the parameter name Average values are not available for voltage and current peak values For current only wirings no average value is available for the current fundamental wave phase angle Data Data format Des...

Page 135: ...ential data can be converted into numerical data Converting Measured Value Exponential Data 1 Select the column labels you wish to convert into numerical data and right click with the mouse 2 Select Format Cells 3 On the Format Cells dialog box click the Number tab 4 Select Number and click OK 5 Select Number and change the number of decimal places as necessary Click Example The figure shows colum...

Page 136: ...ecording and measurement data is supported Installing the software 9 4 Using the PW3360 Auto Excel Graph Cre ation Application Launch Excel and automatically create a graph 1 Click 2 Click 1 Download the PW3360 Auto Excel Graph Creation Application from the Hioki website 2 Install the software on your computer For more information about how to install and use the software see MANU AL pdf which is ...

Page 137: ... 1 Copying Data to a Computer USB p 130 Using free PW3360 Settings and Download Application configure the instrument and download data See 10 4 Using the PW3360 Settings and Download Application USB p 134 Capabilities with a LAN connection Using an Internet browser control the instrument remotely Using free PW3360 Settings and Download Application configure the instrument and download data See 10 ...

Page 138: ...t and computer are both off and connected with the USB cable turn on the computer and then the instrument Powering up the devices in a different order may prevent the instrument and computer from communicating Copying large data files from the SD memory card to a computer via the instrument s USB interface can be time consuming When you need to copy a large data file to a computer it is rec ommend...

Page 139: ...memory card If the SD memory card was formatted with the PW3360 PW3360SD will have been written to the volume label and that label will be displayed If the SD memory card was not formatted with the PW3360 Removable Disk or the previously written volume label will be displayed Internal memory Data on the instrument s SD memory card or internal memory can not be manipulated to delete files change fi...

Page 140: ...t is necessary to install a USB driver See 10 4 Using the PW3360 Settings and Download Application USB p 134 10 2 Installing the USB Driver on a Computer 1 Download the USB driver for PW3360 from the Hioki website 2 Install the driver on the computer For more information about how to install the driver see README pdf which is included in the archive file ...

Page 141: ...figured and data to be downloaded from the instrument using a computer 10 3 Installing the PW3360 Settings and Down load Application USB LAN USB or LAN interface Recording data Control signal 1 Download the PW3360 Settings and Download Application from the Hioki website 2 Install the software on the computer For more information about how to install the software see MANUAL pdf which is included in...

Page 142: ...3360 Settings and Download Application 10 4 Using the PW3360 Settings and Download Application USB Initiating USB Communications between the PW3360 and a Com puter 1 Turn off the instrument 2 Connect the instrument and computer with the included USB cable 3 Turn on the instrument 4 Launch the PW3360 Settings and Download Application USB cable 1 Click 2 Click ...

Page 143: ...ions USB LAN 10 5 Select the USB radio button verify that HIOKI USB DEVICE COMxx is shown in the dialog box and click Connect USB communications will be enabled For more information about how to use the software see the instruction manual which is included in the archive file 1 Click 2 Click ...

Page 144: ...attach a commer cially available ferrite clamp to the USB cable as shown in the fig ure below The effectiveness of the clamp can be increased as follows Place the clamp as close to the computer side connector as pos sible Loop the cable through the clamp several times Ferrite core Position as close to the computer as Reference A ferrite core segmented core from Seiwa Electric Mfg Co Ltd is shown i...

Page 145: ...ications USB LAN 10 Disconnecting the USB Cable from the Computer 1 Exit the PW3360 Settings and Download Application 2 Turn off the instrument 3 Prepare to eject the instrument s USB connection from the computer 4 Disconnect the USB cable from the instrument and computer 1 Click 2 Click ...

Page 146: ... for automatically detecting whether a straight or cross cable is being used 10 5 LAN Communications LAN interface To computer s LAN interface LAN cable The figure shows the 9642 LAN Cable option Wireless LAN router Computer PDA Tablet computer Wi Fi Example of remote operation using wireless LAN When using a wireless LAN router The instrument does not support network environments where an IP addr...

Page 147: ...LAN settings Failure to do so will prevent the LAN settings from taking effect making communication impossible IP Address Identifies each device connected on a network Each network device must be set to a unique address The instrument supports IP version 4 with IP addresses indi cated as four decimal octets e g 192 168 0 1 Subnet Mask This setting is used to distinguish the address of the network ...

Page 148: ...sing addresses 192 168 1 0 to 192 168 1 24 IP Address Computer 192 168 1 1 PW3360 assign to each instrument in order 192 168 1 2 192 168 1 3 192 168 1 4 Subnet Mask 255 255 255 0 Default Gateway Computer ___ ___ ___ ___ PW3360 0 0 0 0 Example 3 Connecting one instrument to a single computer using the 9642 LAN Cable The 9642 LAN Cable can be used with its supplied connection adapter to connect one ...

Page 149: ...rnet interface jack is on the right side Connecting the Instrument and Computer with a LAN Cable To avoid damaging the output cable grasp the connector not the cable when unplugging the cable LINK LED RX TX LED The RX TX LED blinks when sending and receiving data and the LINK LED lights when linked to the destination network device ...

Page 150: ...k when connecting the instrument to a hub Model 9642 LAN Cable optional A 100Base TX straight cable up to 100 m in length commercially available If using a 10Base network a 10Base T ca ble can be used 1 Connect the LAN cable to the instrument s LAN interface 2 Connect the LAN cable to the hub s 100Base TX connector 1 2 100BASE TX ...

Page 151: ...100Base TX straight or cross cable up to 100 m in length 1 Connect the LAN cable to the instrument s LAN interface 2 Connect the LAN cable to the computer s 100Base TX connector 2 1 100BASE TX Since the instrument provides functionality for automatically detecting whether a straight or cross cable is being used a straight cable may also be used If you are unable to establish communications with th...

Page 152: ...pplication 10 6 Using the PW3360 Settings and Download Application LAN Initiating LAN Communications between the PW3360 and a Com puter 1 Turn off the instrument 2 Connect the instrument and computer with a LAN cable See Connecting the Instrument and Computer with a LAN Cable p 141 3 Turn on the instrument 4 Launch the PW3360 Settings and Download Application LAN cable 1 Click 2 Click ...

Page 153: ...ter 10 Using Communications USB LAN 10 5 Select the LAN radio button enter an IP address and click Connect LAN communications will be enabled For more information about how to use the software see the instruction manual that came with the software 1 Click 3 Click 2 Set ...

Page 154: ...3360 Settings and Download Application LAN 146 Disconnecting the Instrument from the Computer 1 Exit the PW3360 Settings and Download Application 2 Turn off the instrument 3 Disconnect the LAN cable from the instrument ...

Page 155: ...Internet Explorer ver sion 8 or later Set the browser security level to Medium or Medium high or enable Active Scripting settings Unintended operations may occur if remote control is attempted from multiple computers simultaneously Use one computer at a time for remote control Remote control can be performed even if the instrument s key lock is active 1 Launch Internet Explorer 2 In the address ba...

Page 156: ...ings on the Connections tab disable the Proxy server setting 1 Check the instrument s LAN settings and the computer s IP address See Configure the Instruments LAN Settings p 139 2 Verify that the LINK LED on the LAN interface is on and that the Web mark is being shown on the instrument s screen See Connecting the Instrument and Computer with a LAN Cable p 141 Be sure to restart the instrument afte...

Page 157: ...eration page will be displayed 2 If a password has been set the following page will be displayed 3 Enter the password and click the SET button The screen and control panel being displayed on the instrument will be shown in the browser If no password has been set or if the password has been set to 0000 the digit zero this page will not be displayed The default password is 0000 Click ...

Page 158: ...f remote operation Setting a Password 1 Click Password Setting on the main page The following page will be displayed 2 Enter the Old Password New Password and Confirm New Pass word fields and click the SET button Enter up to four English letters If setting a password for the first time enter 0000 four zeroes as the Old Password If changing a previously set password enter the previously set passwor...

Page 159: ...ulse signal input Pulse signal output Pulse output device Input a pulse signal from an external source After configuring scaling coeffi cient sub unit and unit five byte charac ters settings you can convert and measure an input pulse signal After re cording and measurement are started pulse input values are saved for each save interval See 11 3 Inputting a Pulse Signal p 154 Pulse input Pulse outp...

Page 160: ...the pulse input and output terminals Ensure that devices and systems to be connected to the pulse input and output terminals are properly isolated To avoid electric shock use the recommended wire type to con nect to the current input terminals or otherwise ensure that the wire used has sufficient current handling capacity and insulation Electric wires that conform with single line 0 65 mm AWG22 tw...

Page 161: ...less with high and low intervals at least 100 μs in duration Pulse output FILTER ON OFF SCALING 0 001 to 1 000 to 100 000 AUX UNIT p n u m none k M G T UNIT Up to 5 byte characters OUTPUT RATE OFF 1 Wh 10 Wh 100 Wh 1 kWh 10 kWh 100 kWh 1000 kWh PULSE WIDTH Fixed to 100 ms cannot be changed Because the active energy value is updated every second the instrument can generate pulse output at a maximum...

Page 162: ... the voltage level changes to high 11 3 Inputting a Pulse Signal To avoid electrical hazards and damage to the instrument do not apply voltage exceeding the rated maximum to the pulse input and output terminals 45 V DC When using a current only wiring pulse input cannot be mea sured Signal Input Method Input voltage range HIGH level 2 V to 45 V LOW level 0 V to 0 5 V Maximum rated voltage between ...

Page 163: ...d Isolate input as necessary If the pulse input cable is grouped with other cables interference such as noise from external sources may cause the instrument to malfunction Pulse input cables should be routed separately Excessively long cables may suffer from interference such as noise from external sources causing the instrument to malfunc tion If you encounter this issue attach a ferrite clamp to...

Page 164: ... specifically at 10 kWh 20 kWh and 30 kWh 11 4 Outputting a Pulse Signal To avoid electrical hazards and damage to the instrument do not apply voltage current exceeding the rated maximum 30 V 5 mA to the pulse input and output terminals Output signal Open collector output photocoupler iso lated Active LOW Maximum input voltage Maximum input current 30 V 5 mAmax Target Active energy consumption WP ...

Page 165: ...uitry Photo coupler Power source 30V or less Pull up resistor Recommended 10 k GND Pulse out High Pulse out Low Example external circuit When using the 1P2W x 2 circuit or 1P2W x 3 circuit wiring set ting the active energy for the first circuit drives pulse output Pulse output cannot be generated for the active energy of the second or third circuit The wire connected to the pulse output terminal s...

Page 166: ...11 4 Outputting a Pulse Signal 158 ...

Page 167: ... Dielectric strength 50 Hz 60 Hz 60 minutes 4 29 kVrms 1 mA sense current Between voltage input terminals and external control terminals Power supply Model Z1006 AC Adapter 12 V 1 25 A Rated supply voltage 100 VAC to 240 VAC Voltage fluctuations of 10 from the rated supply voltage are taken into account Rated power supply frequency 50 60 Hz anticipated transient overvoltage 2500 V Model 9459 Batte...

Page 168: ... 29 3 oz Applicable standards Safety EN61010 Pollution degree 2 EMC EN61326 Class A EN61000 3 2 EN61000 3 3 Accessories Model L9438 53 Voltage Cord 1 set Includes the following Alligator Clip x 4 red yellow blue and black one each 3 m Banana Plug Leads x 4 red yellow blue and black one each spiral tubes for grouping cords x 5 Model Z1006 AC Adapter includes power cord 1 USB cable Ver 2 0 with ferr...

Page 169: ...Clamp on Leak Sensor Model 9675 Clamp on Leak Sensor Model 9290 10 Clamp on Adapter Model 9804 01 Magnet Adapter Red 1 for changing the voltage cord tips Model 9804 02 Magnet Adapter Black 1 for changing the voltage cord tips Model PW9003 Voltage Line Power Adapter for supplying power from measurement lines Model Z1006 AC Adapter Model PW9002 Battery Set Set of 9459 Battery Pack and a battery case...

Page 170: ...ion 1000 VAC 1400 Vpeak Current input section 1 7 VAC 2 4 Vpeak Maximum rated voltage to earth Voltage input section 600 V Measurement Categories III anticipated transient overvoltage 6000 V 300 V Measurement Categories IV anticipated transient overvoltage 6000 V Current input section Depends on clamp sensor in use Measurement specifications Measurement method Digital sampling zero cross synchroni...

Page 171: ...ge waveform peak absolute value current waveform peak absolute value active power reactive power with lag lead display apparent power power factor with lag lead display or displacement power factor with lag lead display active energy consumption regenera tion reactive energy lag lead active power demand quantity con sumption regeneration reactive power demand quantity lag lead active power demand ...

Page 172: ...z Temperature and humidity for guaranteed accuracy 23 C 5 C 73 9 F 80 RH or less applies to all specifications unless otherwise noted Display range of guaranteed accuracy Effective measuring range Period of guaranteed accuracy 1 year Other conditions Real Time Clock function Auto calendar leap year correcting 24 hour clock Real time clock accuracy Within 0 3 s per a day power on within operating t...

Page 173: ...660 9695 03 1mV A 5 0000 10 000 50 000 100 00 A Model 9661 1mV A 5 0000 10 000 50 000 100 00 500 00 A Model 9669 0 5mV A 100 00 200 00 1 0000k A Model 9694 10mV A 500 00m 1 0000 5 0000 10 000 50 000 A Model 9695 02 10mV A 500 00m 1 0000 5 0000 10 000 50 000 A Model CT9667 500A range 1mV A 500 00 A Model CT9667 5000A range 0 1mV A 5 0000k A Leakage current Model 9657 10 9675 100mV A 50 000m 100 00m...

Page 174: ...asurement range Combination of voltage current range See 12 6 Range Configuration and Accuracy by Clamp Sensor p 187 Measurement accuracy 45 Hz to 66 Hz 0 3 rdg 0 1 f s clamp sensor specifications power factor 1 With a fundamental frequency of 50 60 Hz Up to 1 kHz 3 rdg 0 2 f s clamp sensor specifications Up to 3 kHz 10 rdg 0 2 f s clamp sensor specifications Phase effects Equivalent to 0 3 of pha...

Page 175: ...e power p 182 Measurement range Combination of voltage range current range See 12 6 Range Configuration and Accuracy by Clamp Sensor p 187 Measurement accuracy With a fundamental wave frequency of 45 Hz to 66 Hz 0 3 rdg 0 1 f s clamp sensor specifications reactive factor 1 Phase effects Equivalent to 0 3 of phase accuracy at 50 60 Hz f s input Lag Lead display Positive Lag Negative Lead Output dat...

Page 176: ...wer See Power factor Displacement power factor p 183 Measurement range Lag 0 0000 to 1 0000 Lead 0 0000 to 1 0000 Measurement accuracy 1 dgt relative to calculations from measured values Lag Lead display Uses the sign of reactive power Q fundamental wave reactive power Positive Lag Negative Lead Output data For SD memory card and internal memory output data the polarity indicates lag lead Lag Posi...

Page 177: ... the start of recording See Electric energy p 184 Measurement range Active energy Consumption WP 0 00000 mWh to 99999 9 GWh Regeneration WP 0 00000 mWh to 99999 9 GWh Reactive energy Lag WQ_LAG 0 00000 mvarh to 99999 9 Gvarh Lead WQ_LEAD 0 00000 mvarh to 99999 9 Gvarh Measurement accuracy Active power and reactive power measurement accuracy 1 dgt Integration time accuracy 10ppm 1sec Active power d...

Page 178: ...r lag and lead for each interval time See Demand value Pulse input p 186 Measurement items Active power demand value Consumption Pdem Regeneration Pdem Reactive power demand value Lag Qdem_LAG Lead Qdem_LEAD Measurement accuracy Active power and reactive power measurement accuracy 1 dgt Power factor demand value PFdem Measurement method Calculated from the active power demand value Pdem and the re...

Page 179: ... operations Quick Set Provides information about procedures associated with measure ment settings wiring types wiring check wiring confirmation recording settings and recording initiation Wiring diagram screen Wiring diagram screen Displays wiring diagrams for single phase 2 wire 1P2W single phase 3 wire 1P3W 1P3W1U 3 phase 3 wire 3P3W2M 3P3W3M and 3 phase 4 wire 3P4W connections Wiring check scre...

Page 180: ...0 1mV A 5 0000k A Leakage current Model 9657 10 9675 100mV A 50 000m 100 00m 500 00m 1 0000 5 0000 A CT ratio User specified 0 01 to 9999 99 Selected 1 40 60 80 120 160 200 240 300 400 600 800 1200 Voltage range 600 V fixed VT PT ratio User specified 0 01 to 9999 99 Selected 1 60 100 200 300 600 700 1000 2000 2500 5000 PF Q S calculation selection RMS calculation fundamental wave calculation Remai...

Page 181: ...on the backlight turns back on when any key is operated including when the key lock is engaged Screen color Screen color can be selected color 1 color 2 color 3 Beep sound ON OFF Language Japanese English Phase name R S T A B C L1 L2 L3 U V W System reset A system reset causes the instrument settings to be reset to their default values However the time language frequency IP address subnet mask and...

Page 182: ...undamental wave value Ifnd current waveform peak IPeak Ipk current fundamental wave phase angle Ideg Power Per channel and total active power P apparent power S reactive power Q power factor PF or displacement power factor DPF Integ Active energy consumption WP regeneration WP reactive energy lag WQ lead WQ recording start time recording stop time elapsed time Waveform Displays voltage and current...

Page 183: ...arity Apparent power S Reactive power Q Signed simple average Lag positive data polarity Lead negative data polar ity simple maximum and minimum Power factor PF Calculated from Pavg and Savg Maximum and minimum absolute value Signed data based on Lag positive Lead negative Displacement power factor DPF Calculated from P 1 avg and Q 1 avg Maximum and minimum absolute value Signed data based on Lag ...

Page 184: ... No display fixed to 1 Clamp sensor 9660 100 A 9661 500 A 9669 1 000 A 9694 5 A 9695 02 50 A 9695 03 100 A CT9667 500 A CT9667 5 000 A CT ratio No display fixed to 1 PF Q S calculation selection No display RMS calculation Save destination SD card disabled Save to internal memory if no SD card has been inserted Wirings Wirings Connect cords to the instrument Make voltage wirings Check level phase a...

Page 185: ...saving no display Folder file name Automatic user selected Recording start method Interval time manual specified time Recording stop method Manual specified time Time setting Time setting Quick Set start at power on Do not display off Recording start Card insertion Insert an SD card skip if already inserted Recording start confirmation Display the remaining save time and check start of recording S...

Page 186: ...02 3 compliant Transmission method 10BASE T 100BASE TX Protocol TCP IP Functions HTTP server function Capture of settings and measurement data and data downloading with a communications application USB interface Method USB Ver 2 0 full speed high speed Mass storage class virtual COM CDC Connection destination Computer Supported operating systems WindowsXP WindowsVista 32bit Windows7 32 64bit With ...

Page 187: ...shorted to open Voltage input high 2 V to 45 V low 0 V to 0 5 V counted when changes to high Measure ment range 0 to 9 999 defined as maximum number of pulses during the save interval time Maximum rated input between terminals 45 V DC Maximum rated input between terminals and ground Not isolated GND common with instrument Filter Filter ON mechanical contact use Frequencies of 25 Hz or less with hi...

Page 188: ...ESC key for at least 3 seconds Power supply display AC adapter battery Remaining battery display Displays the remaining battery life in four stages Warning displays Over range Displays over range over Calculation results are used as is internally Peak over Displays a warning Frequency error When the measurement line frequency differs from the set fre quency 50 60 Hz displays an error message and c...

Page 189: ...Uc For 3P3W2M connections it is assumed that U1s U2s U12s 0 For 3P3W3M connections the phase voltage u is measured from the virtual neutral point and used to calculate the line to line voltage Current I Arms I1 I1 I2 I1 I2 I12 I12s I1s I2s I1 I2 I3 I1 I2 I3 Ic For 3P3W2M it is assumed that I1s I2s I12s 0 1 M Ucs 2 S 0 M 1 1 M Ics 2 S 0 M 1 Active power Wiring setting Item Single phase 2 wire Singl...

Page 190: ...l wave reactive power is used Positive sign Lag Display indicates LAG and output data is positive Negative sign Lead Display indicates LEAD and output data is negative Q1 Q1 Q2 Q1 Q2 U1 1 r I2 1 i U1 1 i I2 1 r Q1 Q2 Q1 Q2 Q3 PF Q S fundamental wave calcu lation Qc Uc 1 r Ic 1 i Uc 1 i Ic 1 r Q Q1 Q2 Q Q1 Q2 Q3 This reactive power Q is defined as the fundamental wave reactive power 1 Harmonic calc...

Page 191: ...tive power S is defined as the fundamental wave reactive power 1 Harmonic calculation fundamental wave 1st order 3 3 S1 S2 S3 3 3 U1I1 U2I2 U3I3 Pc 1 2 Qc 1 2 P 1 2 Q 1 2 Power factor Displacement power factor Wiring setting Item Single phase 2 wire Single phase 3 wire Three phase 3 wire Three phase 4 wire 1P2W 1P3W 1P3W1U 3P3W2M 3P3W3M 3P4W Power factor PF PF Q S RMS cal culation PF1 PF1 PF2 PF1 ...

Page 192: ...3W1U 3P3W2M 3P3W3M 3P4W Pc 1 Sc 1 P 1 S 1 Electric energy Wiring setting Item Single phase 2 wire Single phase 3 wire Three phase 3 wire Three phase 4 wire 1P2W 1P3W 1P3W1U 3P3W2M 3P3W3M 3P4W Active energy consumption WP Wh WP k Calculation unit time h h measurement duration P Only the consumption component of active power positive component is used Active energy Regenera tion WP Wh WP k Calculati...

Page 193: ...ive power positive component is used Active power demand quan tity Regeneration WP dem Wh WP dem k Calculation unit time h h interval duration P Only the regeneration component of active power negative component is used Reactive power demand quan tity Lag WQLAGdem varh WQLAGdem LAG k Calculation unit time h h interval duration Q LAG Only the lag component of reactive power is used Reactive power d...

Page 194: ...P Only the regeneration component of active power negative component is used Reactive power demand value Lag Qdem_LAG var Qdem_LAG LAG h Interval duration Q LAG Only the lag component of reactive power is used Reactive power demand value Lead Qdem_LEAD var Qdem_LEAD LEAD h Interval duration Q LEAD Only the lead component of reactive power is used Power factor demand value PFdem PFdem Pulse input P...

Page 195: ...130 f s of the range If a measurement is below 0 4 f s it will be zero sup pressed Power measurement is indicated as 0 to 130 f s of the range It will be zero suppressed when the voltage or current is 0 The range configuration for apparent power S and reactive power Q is the same except that the unit is changed to VA and var respectively When the VT ratio and CT ratio are set the ranges will be mu...

Page 196: ...0 00 kW Combined accuracy Current range Model 9660 sensor Model 9695 03 sensor Model 9661 sensor 500 00A 0 6 rdg 0 11 f s 100 00A 0 6 rdg 0 12 f s 0 6 rdg 0 15 f s 50 000A 0 6 rdg 0 14 f s 0 6 rdg 0 2 f s 10 000A 0 6 rdg 0 3 f s 0 6 rdg 0 6 f s 5 0000A 0 6 rdg 0 5 f s 0 6 rdg 1 1 f s When the 9669 is Used Power ranges Voltage Wiring Current range 100 00 A 200 00 A 1 0000 kA 600 00 V 1P2W 60 000 kW...

Page 197: ...P4W 900 00W 1 8000kW 9 0000kW 18 000kW 90 000kW Combined accuracy Current range Model 9694 sensor Model 9695 02 sensor 50 000 A 0 6 rdg 0 12 f s 10 000 A 0 6 rdg 0 2 f s 5 0000 A 0 6 rdg 0 12 f s 0 6 rdg 0 3 f s 1 0000 A 0 6 rdg 0 2 f s 0 6 rdg 1 1 f s 500 00mA 0 6 rdg 0 3 f s 0 6 rdg 2 1 f s When the CT9667 is Used Power ranges Voltage Wiring Current range 500 A range 500 00 A 5000 A range 5 0000...

Page 198: ...ge AC240 V Rated current AC3 15 A Maximum rated voltage to earth 300 V Measurement Categories III anticipated transient overvoltage 4000 V Dielectric strength 50 Hz 60 Hz 60 minutes 4 29 kVrms 1 mA sense current Between power supply pins and case Operating tempera ture and humidity 10 C to 50 C 14 F to 122 F 80 RH or less non condensating Storage tempera ture and humidity 20 C to 60 C 4 F to 140 F...

Page 199: ...ery Approx 10 years The instrument contains a built in backup lithium battery which offers a service life of about ten years If the date and time deviate substantially when the instrument is switched on it is the time to replace that battery Contact your authorized Hioki distributor or reseller Electrolytic Capacitors Approx 10 years The service life of electrolytic capacitors varies with the oper...

Page 200: ... that the calibration frequency is determined in accordance with the status of the instrument or installation environment and that you request that calibration be performed periodically Precautions when transporting the instrument When sending the instrument for repair remove the battery pack and SD memory card carefully to prevent damage in transit Include cushioning material so the instrument ca...

Page 201: ...the PW9002 Battery Set 9459 Battery Pack been properly installed Has the battery pack been charged Verify that the battery pack has been charged and installed See Installing replacing the Battery Pack p 24 Keys do not work Has the key lock been acti vated Press and hold the ESC key for at least 3 seconds to cancel the key lock Voltage or current measured values are not being dis played Are the vol...

Page 202: ...60 Hz See 4 3 Changing Recording Save Settings p 65 Unable to charge the 9459 Battery Pack the Charge LED does not light up Verify that the ambient temperature is within the range of 10 C to 40 C The instrument s battery can be charged within the ambient tempera ture range of 10 C to 40 C See Installing replacing the Battery Pack p 24 Has the instrument been stored for an extended period of time w...

Page 203: ...nstrument must be repaired A program failure has occurred The instrument needs to be repaired Contact your authorized Hioki distributor or reseller SYSTEM ERROR The SDRAM of the PW3360 is corrupted and the instrument must be repaired A memory failure has occurred SYSTEM ERROR The adjustment values of the PW3360 are corrupted and the instrument must be repaired An adjustment value failure has occur...

Page 204: ...ls within 1 mW to 9 9999 GW See 12 6 Range Configura tion and Accuracy by Clamp Sensor p 187 ERROR Only PW3360 folders can be opened You cannot move higher up in the folder hierarchy than the root on the SD memory card by pressing the left arrow key Select a folder or file with the up and down arrow keys and switch folders by press ing the right arrow key or the Enter key See 8 1 Viewing and Using...

Page 205: ...ute is set to read only If the SD memory card is locked unlock it If the file or folder attribute is set to read only change the attribute using a com puter FILE ERROR The file with the same name exists The instrument was unable to copy data from its internal memory to the SD memory card because data with the same filename already existed on the SD memory card Delete the data with the same filenam...

Page 206: ...D CARD ERROR SD Card locked Unlock the SD Card The SD memory card is in the locked write protected state Unlock the SD memory card See 2 4 Inserting Remov ing an SD Memory Card p 29 SD CARD ERROR Data has been backed up to internal memory Data will be saved to the instrument s internal mem ory if no SD memory card has been inserted or the SD memory card is full while performing recording and measu...

Page 207: ...emory Card p 109 8 7 Deleting Folders and Files p 110 SD CARD ERROR This is a read only file The SD memory card is in the locked write protected state or the file or folder attribute is set to read only If the SD memory card is locked unlock it If the file or folder attribute is set to read only change the attribute using a com puter Error display Cause Solution more information Error display Caus...

Page 208: ...streated Do not short circuit recharge disassemble or dispose of in fire Keep batteries away from children to prevent accidental swallowing CALIFORNIA USA ONLY This product contains a CR Coin Lithium Battery which contains Perchlorate Material special handling may apply See www dtsc ca gov hazardouswaste perchlorate Phillips head screwdriver Tweezers 1 Turn off the power switch 2 If any cords are ...

Page 209: ...right sides of the instrument remove them 4 Using a Phillips head screwdriver remove the four screws holding the lower case on the bottom of the instrument 5 Remove the lower case 6 Remove the single screw holding the board in place and remove the board 7 Insert a pair of tweezers between the bat tery holder and the battery and lift up to remove the battery ...

Page 210: ...13 4 Disposing of the Instrument 202 ...

Page 211: ...dings for the same channel Sampling between channels for voltage U1 U2 and U3 and current I1 I2 and I3 is shifted The phase differences that result from this sampling shift are corrected internally and the phase angle is displayed However since waveforms are not corrected for sampling shift the waveforms for U1 U2 and U3 as well as I1 I2 and I3 will differ slightly if the same input is supplied to...

Page 212: ...nd three line phase currents are measured The 3 phase active power P can be derived from two voltage and current values as shown below P because 0 due to precondition of a closed circuit 2 Since equations 1 and 2 agree it is possible to prove that 2 wattmeter measure ment can be used to measure the power of a 3 phase 3 wire line Since the only special conditions are that the target be a closed cir...

Page 213: ...e power P1 Since the three phases are calculated from two power meter it is not possible to check the active power balance for individual phases It is possible to check the active power balance for individual phases P2 P3 P See equation 2 Apparent power When the PF Q S calcula tion selec tion is set to RMS S1 U1I1 Since calculations are based on the line to line voltage and phase line current appa...

Page 214: ...64 Relative merits Model 3169 20 21 3P3W3M The reactive power meter method is not used Voltage U1 U2 U3 Current I1 I2 I3 Active power P1 P2 P3 P P1 P2 P3 P1 P2 P3 Apparent power S1 u1I1 Since calculations are based on the phase voltage and phase line current it is possible to check the apparent power for each of the three phases U1I1 Since calculations are based on the line to line voltage and lin...

Page 215: ... accuracy Power factor accuracy based on phase accuracy Phase accuracy in combination with clamp sensor Instrument phase accuracy 0 3 Model 9661 phase accuracy 0 5 0 8 Phase difference cos 1 power factor cos 10 8 36 87 Power factor error range based on phase accuracy cos 36 87 0 8 Min 0 7915 to max 0 8083 Power factor accuracy based on phase accuracy minimum 1 06 Use the worst value as the power f...

Page 216: ...ve power which is not consumed and the lower the efficiency The mini mum absolute value is 0 A positive value LAG indicates that the current phase is lagging the volt age Inductive loads such as motors are characterized by lagging phase A negative value LEAD indicates that the current phase is leading the voltage Capacitive loads such as capacitors are characterized by lead ing phase Sign is rever...

Page 217: ... reactive power Reactive power demand value The average reactive power used during a set period of interval time usu ally 30 minutes RMS value The square root of the squares of 1 024 sampling points in a 200 ms inter val The value includes harmonic components SD memory card A type of flash memory card Text data A file containing only data expressed using characters and character codes USB An inter...

Page 218: ...A8 ...

Page 219: ...1 44 52 62 D Default 27 75 76 Default gateway 139 Demand 66 Demand quantity 125 Demand value 125 Displacement power factor 54 64 80 A 6 DPF 54 64 80 A 6 E Energy 80 83 Enlarge 86 Error indication 195 Excel 113 118 128 Exponential 127 F Factory reset 27 75 Factory settings 76 File 67 97 Folder 67 97 Format 29 111 Frequency 27 61 80 Fundamental wave 64 81 Fundamental wave apparent power 64 Fundament...

Page 220: ...0 82 Power cord 32 Power factor 54 64 80 82 A 6 Power factor demand value 126 A 6 Power Logger Viewer 116 Power outage 92 Power switch 37 PT 34 39 63 Pulse 151 Q Quick Set 73 93 176 R Reactive power 64 80 82 A 7 Recording 87 Recording and measurement 87 Recording start 69 87 Recording stop 70 87 91 Recording time 19 Regeneration 83 Removable disk 115 131 RMS 64 80 81 S Sampling A 1 Save destinatio...

Page 221: ...2 Voltage 80 Voltage cord 2 22 39 Voltage input terminal 16 46 Voltage Line Power Adapter 34 Voltage phase 56 Voltage range 63 Voltage transformer 34 VT 34 39 63 W Waveforms 84 Wireless LAN 138 Wiring 61 Wiring check 54 Wiring diagram 41 Z Zero suppression 163 187 ...

Page 222: ...Index Index 4 ...

Page 223: ......

Page 224: ......

Reviews: