5
Trend Graph Display
At the
Worksite
Review Results
Measured values can be displayed as a graph, which is convenient when using the instrument in power
management applications. Since you can statistically review not only the measured value at that moment, but also
measured values that have been recorded, it’s easy to check values on the spot.
Display measured values as a graph
and evaluate results at a glance
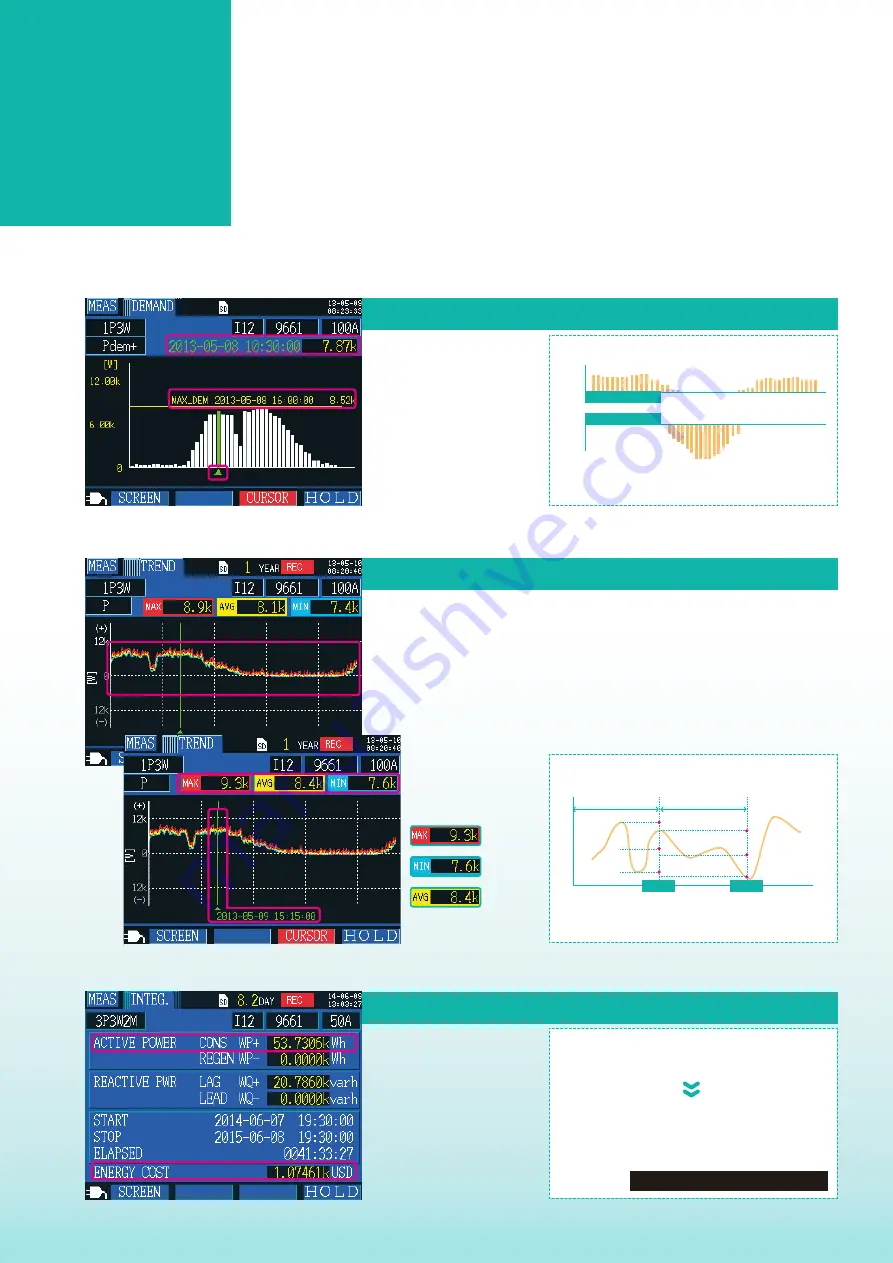
Demand Graph Display
* Except for demand
Graph of values measured over a period 24 hours at 5-minute intervals
Bar graph of values measured over a period of
24 hours at a 30-minute interval
It’s easy to check the
maximum demand value and
the time at which it occurred.
Maximum Demand Values
cursor
Read values at cursor
Particularly useful in power
management applications
Display demand
value trends
Example
Power trend graph display
Monitor power variations to check for connections between equipment operating status
and power consumption.
Identify these parameters right on the time-axis graph display
Choose one measured parameter
to create a time-series display as a graph
Display the maximum, minimum,
and average values at the cursor position
Read values at cursor
Trend Graph Display
You can create a bar graph that makes it obvious whether
power is being bought or sold by switching the active power
demand value display from consumption to regeneration
Evaluate Photovoltaic Generation Capabilities
(consumption) P dem+
(regeneration) P dem-
P dem+
Time
kW
kW
P dem-
Power Sold
Power Purchased
Maximum
Value
Minimum
Value
Average
Value
Data interval (1s to 60min)
Set the power logger to save all parameters to
record the maximum, minimum, and average values
during the set recording interval.
Capture and record all fluctuations
Maximum data
Maximum data
Minimum data
Minimum data
Average data
Average data
Record
Record
Display electricity charges
Know how much you are
spending on electricity in real-
time
Convert integrated
power use to
electricity charges
Displaying electricity charges
Active power use 1 kWh × set rate
Calculate electricity charges
[ Example screenshot to left ]
The electricity charge per 1kWh has been set to $20
Active power use 53.7306kWh × set rate 20 USD
electricity charges 1074.61 USD


