9
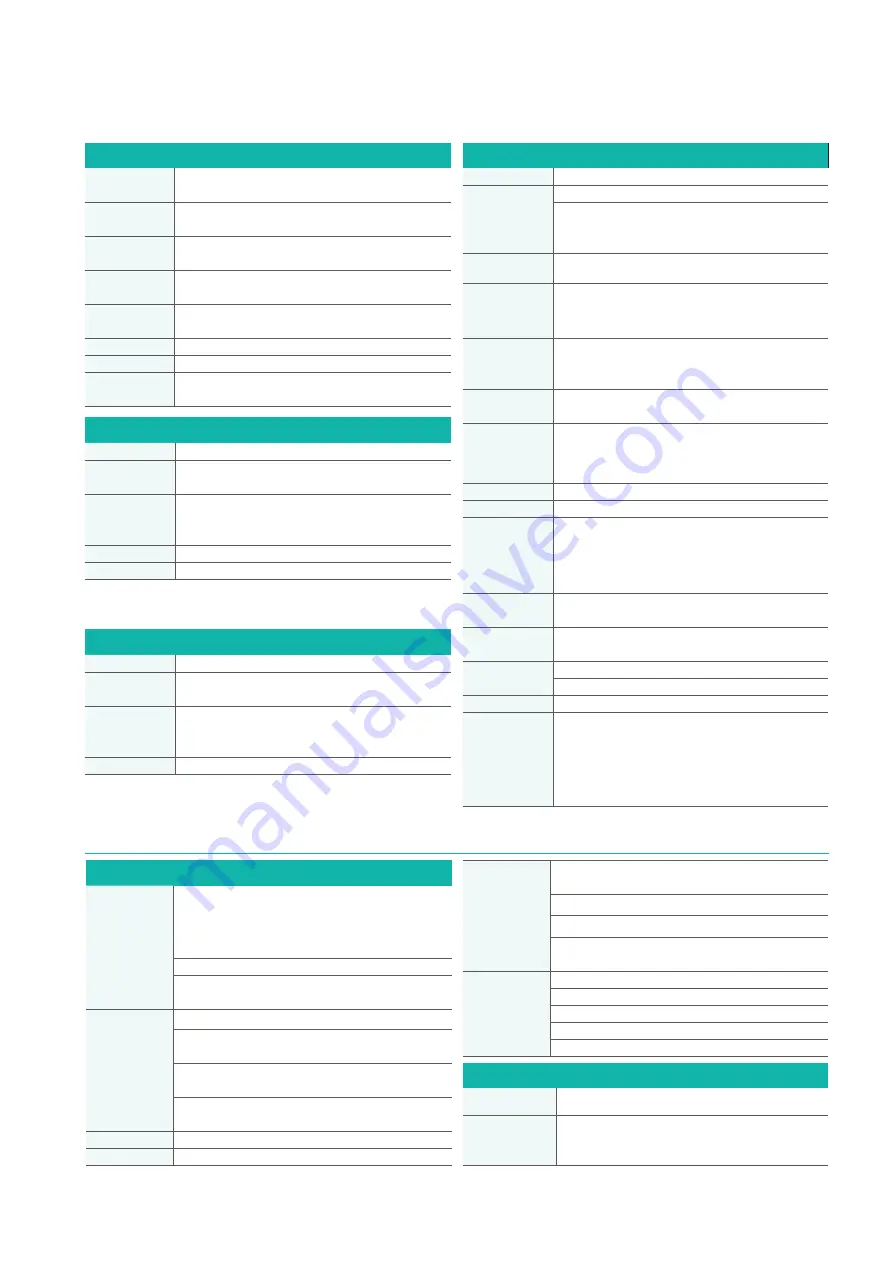
Recording
Save destination
SD Card, internal memory (capacity: approx. 320 KB)
S a v e i n t e r v a l
time
1/2/5/10/15/30 seconds, 1/2/5/10/15/20/30/60 minutes
Available storage time is displayed on the PW3365-20's setting screen
Save items
Measurement save : Average only/average, maximum, minimum
Screen save : Saves the displayed screen as a BMP at a fixed interval*
1
Waveform save : Stores binary waveform data*
2
Recording start methods
Interval time, manual, or at specified time, repeat
Recording stop methods
Manual, or at specified time (up to one year), timer
Screen display
List
Voltage, current, frequency, active/apparent/reactive power
power factor, integrated power use, elapsed time
U/I
RMS value, fundamental wave value,
waveform peak, phase angle
Power
Per-channel and total active power, apparent power, reactive
power,power factor
Integ
Active energy, reactiv energy, recording start time
recording stop time, elapsed time, energy cost
Demand
Active power demand value, reactive power demand value
power factor demand value
Waveform
Displays voltage and current waveform
Zoom
Enlarged view of 4 user-selected parameters
Trend
For one selected measurement item
displays maximum, average and minimum values
External interfaces
SD card
Settings data, measurement data, screen data, waveform data
LAN
10BASE-T/100BASE-TX IEEE802.3 Compliance
- HTTP server function
USB
USB Ver 2.0, Windows 8 (32/64bit)/Windows 7 (32/64bit) / Vista (32bit) /XP
- When connected to a computer, the SD Card and internal
memory are recognized as removable storage devices.
LAN/USB
Download settings and data using free application program
Functions
Trend graph
display function
Display items
Voltage, current, active power, reactive power, apparent power,
power factor, frequency, integrated active power, integrated
reactive power, demand volume, demand value, voltage
disequilibrium factor
Stacked bar graph display : Up to 16 types of data series
Cursor measurements
Measurement values can be displayed by the cursor
Summary
display
function
Displayed items are the same as for the trend Graph Display
Daily, weekly and monthly report displays: Accumulates and
displays daily, weekly and monthly reports over specified period.
Load factor calculation display: Calculates and displays load factor
and demand factor results with daily, weekly and monthly reports
Time span aggregation: Aggregates data into up to four
specified time spans
Waveform display
Displays waveform data at specified date and time
Copy function
Captures any display image to the clipboard
Print function
Preview and print content shown on the trend graph, report,
harmonic graph and settings displays.
Comment entry (Text comments can be entered in any printout)
Header/Footer settings: Sets the header and footer for each printout
Printing support
Any color or monochrome printing supported by the operating system
Report printing
Print (static) contents over a specific time period
Output contents: Standard or selected output items
Available output items: Trend graph, summary, daily report, waveform
Report creation method: Standard print
Report output settings: Save/load report output settings
General Specifications
Supported models
PW3365-20 / PW3360-20 / PW3360-21
LR5000 series ; Data previously loaded by the LR5000 Utility (.hrp2 format) using a PC
Supported
computer
operating systems
Windows 8 (32/64bit)
Windows 7 SP1 or later (32/64bit)
Windows Vista SP2 or later (32bit)
Windows XP SP3 or later (32bit)
General
Product guarantee
One year
Display
3.5 inch TFT color LCD (320 × 240 pixel)
Japanese, English, Chinese
Backlight auto-off function (after 2 minutes)
When AUTO OFF is active, the Power LED blinks
Operating
environment
Indoors, Pollution degree 2, altitude up to 2000 m (6562-ft.)
Operating
temperature and
humidity
(no condensation)
-10°C to 50°C (14°F to 122°F), 80% RH or less
During battery operation: 0°C to 40°C (32°F to 104°F), 80% RH or less
During battery charging: 10°C to 40°C (50°F to 104°F), 80% RH or less
Storage
temperature and
humidity
(no condensation)
0°C to 60°C (32°F to 140°F), 80% RH or less
However, the batteryُs storage temperature
range is -10°C to 30°C (14°F to 86°F)
Maximum rated voltage
between terminals
Voltage input section : 1.7 VAC, 2.4 Vpeak
Current input section : 1.7 VAC, 2.4 Vpeak
Maximum rated
voltage to earth
Voltage input section: 600V Measurement Category III
300V Measurement Category IV
Current input section: Depends on clamp sensor in use.
Dielectric strength
7.06 kVrms AC
Applicable standards
Safety: EN61010, EMC: EN61326, EN61000-3-2, EN61000-3-3
Power supply
(1) Z1008 AC Adapter : 100 VAC to 240 VAC
Maximum rated power : 45VA (including AC adapter)
(2) Model 9459 Battery Pack : Ni-MH DC7.2 V 2700 mAh
Continuous battery operation time
Approx. 5 hr.
Maximum rated power : 3VA
Charge function
Charge time: Max. 6 hr. 10 min. (reference value at 23°C)
Charges the battery regardless of whether the instrument is on or off
Backup
battery life
Clock and settings (Lithium battery),
Approx. 10 years @23°C (@73.4°F)
Dimensions
Approx. 180W(7.09") × 100H(3.94") × 48D (1.89") mm (without PW9002)
Approx. 180W(7.09") × 100H(3.94") × 68D (2.68") mm (with PW9002)
Mass
Approx. 540g (19 oz) (without PW9002), Approx. 820g (28.9 oz) (with PW9002)
Accessories
SAFETY VOLTAGE SENSOR PW9020 (1 set)
AC ADAPTER Z1008 (1)
USB cable (1)
Instruction manual (1)
Measurement guide (1)
Color spiral tubes (1 set : red, yellow, blue/four each)
Spiral tubes (10)
POWER LOGGER VIEWER SF1001 Specifications
*1
The minimum interval time for saving screen copies is 5 min. If the setting is less than 5 min.,
screen copies will be saved every 5 min.
*2
With shortest interval of 1 minute.When set to less than 1 minute, waveforms are saved once every minute


