13. Troubleshooting
13-65
d) DHP information
You can view DHP information from the ET.NET module operation history. From the BASE
SYSTEM/S10VE main menu, click
RAS
and then
DHP Information
to view the DHP information.
For
Module Name
, the names
ET.NET (Main)
and
ET.NET (Sub)
are displayed. From the
Module
Name
drop-down list, select the applicable ET.NET module.
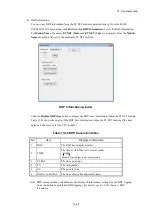
DHP Information window
Click the
Display DHP trace
button to display the DHP trace information within the ET.NET module.
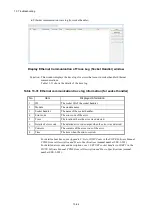
Table 13-32 shows the details of the DHP trace informaiton within the ET.NET module. (The trace
details are the same as for the CPU module.)
Table 13-32 DHP trace information
No.
Item
Displayed information
1
DHP
The DHP trace display number.
2
TIME
The time at which the trace was recorded.
tt.tttttt
Second Time output to one microsecond
3
EVENT
The trace point type.
4
TN
The task number.
5
LV
The priority level.
6
DATA1 to DATA5
The trace data (in hexadecimal format).
Note: DHP tracing includes, in addition to the display of information, settings for the DHP logging
mode (permitted or prohibited DHP logging). For details, see
8.4.6.9 RAS menu: DHP
Information
.
Summary of Contents for S10VE
Page 1: ...User s Manual General Description SEE 1 001 A ...
Page 2: ...User s Manual General Description ...
Page 53: ...This page is intentionally left blank ...
Page 59: ...This page is intentionally left blank ...
Page 67: ...This page is intentionally left blank ...
Page 75: ...This page is intentionally left blank ...
Page 77: ...This page is intentionally left blank ...
Page 103: ...This page is intentionally left blank ...
Page 129: ...This page is intentionally left blank ...
Page 295: ...This page is intentionally left blank ...
Page 309: ...This page is intentionally left blank ...
Page 341: ...This page is intentionally left blank ...
Page 345: ...This page is intentionally left blank ...
Page 475: ...This page is intentionally left blank ...
Page 489: ...This page is intentionally left blank ...
Page 505: ......

