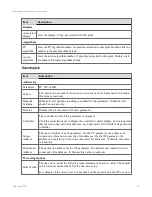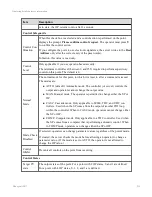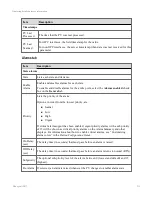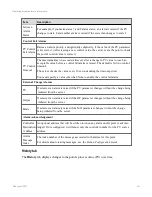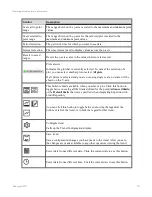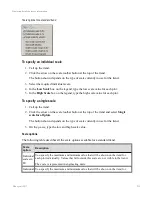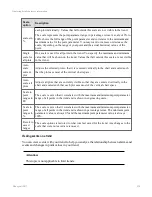
Control
Description
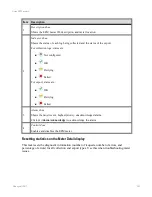
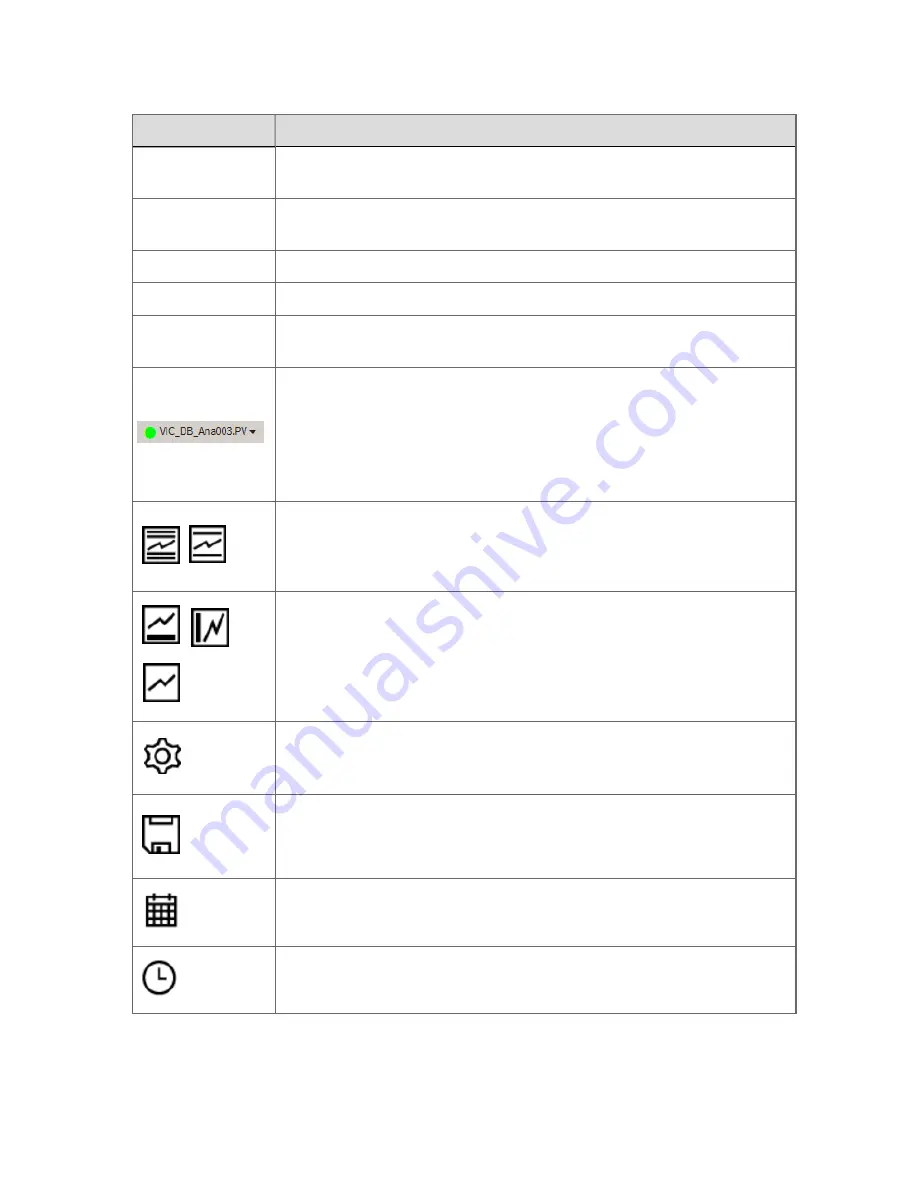
Scale all to point
range
The range shown on the y-axis is scaled to the maximum and minimum point
values.
Scale selected to
point range
The range shown on the y-axis for the selected plot is scaled to the
maximum and minimum point values.
Period selection
The period of time for which you want to see data.
Interval selection
The time interval used to display values across the x-axis.
Revert to saved
ranges
Resets the y-axis scales to the values that were last saved.
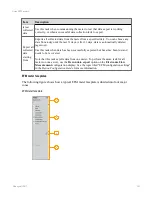
Plot selector
Indicates the plot that is currently selected. To cancel the selection of a
plot, you can select another plot or select
All plots
.
If all plots are selected and you are not using single scale, no scale will be
shown on the Y-axis.
This button is made available when you select a plot. Click this button to
toggle between seeing all the limits defined for the point (
Advanced limits
)
or the
Default limits
that were specified when integrating Experion with
Limit Repository.
You can click this button to toggle between showing the legend at the
bottom or left of the trend, or to hide the legend for this trend.
Configure trend
Calls up the Trend Configuration display.
Save trend
Saves configuration changes you have made to the trend. After you save,
the changes are made available to any other operators viewing the trend.
Select data from a different date. Click the current date to see this button.
Select data from a different time. Click the current date to see this button.
Displaying detailed process information
Honeywell 2017
227

