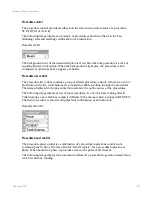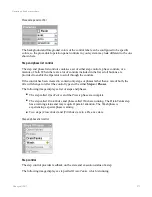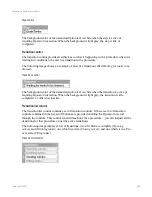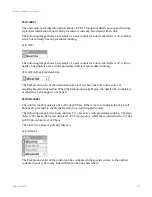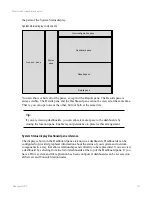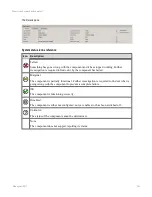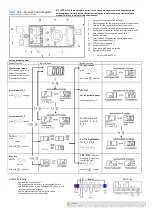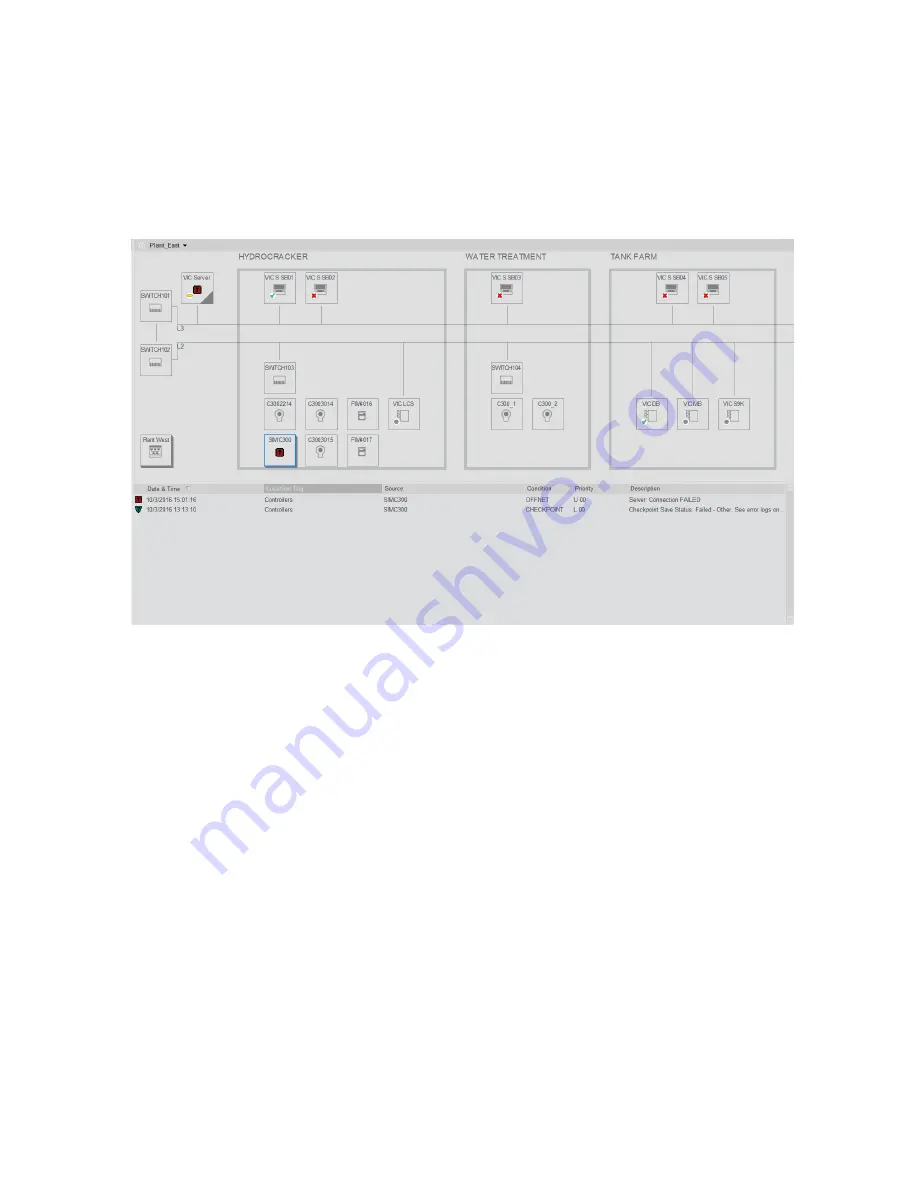
Click an item on the dashboard to see the details of associated alarms. If another dashboard is
linked to the item, you can double-click to call up the linked dashboard. Alternatively,
double-clicking will call up the point detail display of the corresponding point. You can also
right-click to select the point detail display or associated display.
Dashboard pane
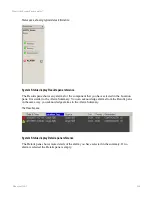
System Status display Location pane reference
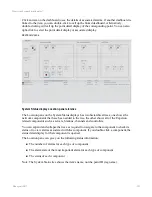
The Location pane on the System Status displays has two hierarchical trees; one shows the
network components that have been added to the tree, the other shows all of the Experion
related components such as servers, Stations, channels and controllers.
You can expand and collapse the trees as required to navigate to the component to check its
status or to view alarms associated with the component. If you double-click a component, the
status detail display for that component is opened.
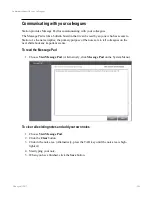
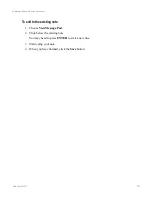
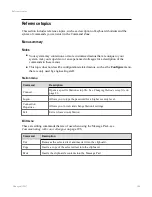
The Location pane can give you the following status information:
n
The number of alarms for each type of component
n
The alarm state of the most important alarm for each type of component
n
The status of each component
Note: The System Status tree shows the item’s name, not the point ID (tag name).
What is the System Status display?
Honeywell 2017
292

