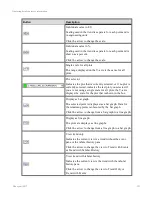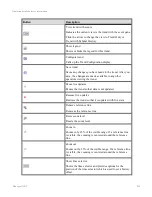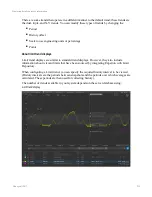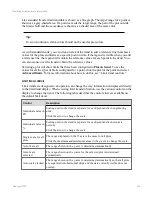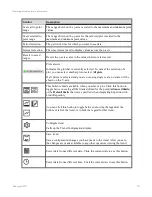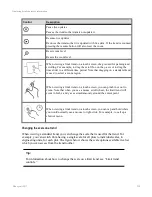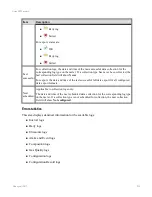
To zoom out on a trend
1. Click Reset Zoom to return to the original zoom level.
Tip:
Alternatively, on standard trends, you can click the Zoom out button to
zoom out at increments of 25%.
Highlighting a plot on a trend
You can highlight a plot to make it easier to see against other plots on a trend. Highlighting a
plot on a standard trend makes the plot line bold.
Some functions work on a single plot, in which case you must highlight the particular plot to
apply these functions; for example, to show a plot as a bar graph.
Attention:
To highlight or select a plot on a limit trend, click the plot. To cancel the selection
of a plot on a limit trend, you can click on the plot, select another plot or select
All
plots
.
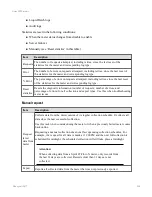
To control the highlight of a plot on a standard trend
1. Do one of the following:
l
In the plot list above the chart area, select the box to the left of the trend name.
(To remove the highlight, select the check box again.)
l
In the legend, select the
Pen
check box for the trend plot. (To remove the
highlight, clear the check box.)
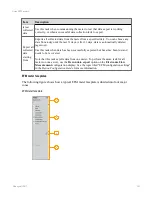
SCADA Controllers display
The
SCADA Controllers
display lists the channels and controllers configured for each
server in your system, within your scope of responsibility.
Status counts
at the top right of the display provide an overview of the status of controllers
within your scope of responsibility.
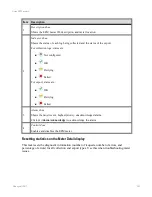
Displaying detailed process information
Honeywell 2017
233

