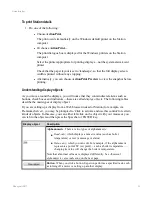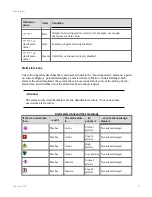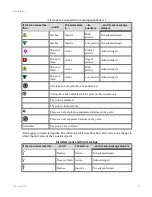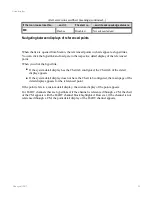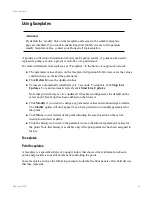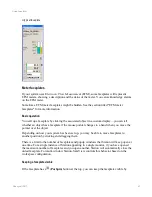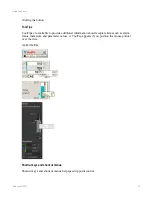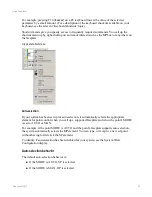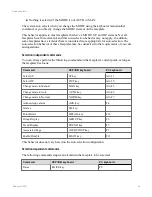
Display object
Description
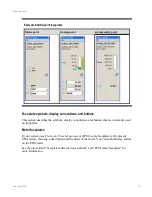
Chart
. Charts display real-time or historical information in a graphical
manner. Charts can simultaneously display several types of information,
such as the temperature and pressure of a boiler. Charts can also display
information in the most appropriate form, such as lines or bars.
If a chart is larger than its 'window', you can use the scroll bars to move
around the chart. For example, if the chart is very long, moving the
horizontal scroll bar to the left or right moves the chart to the left or right.
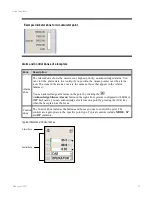
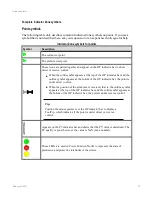
Check box
. When you click a check box, you select or clear an option. An
'x' in the check box indicates that the option is selected.
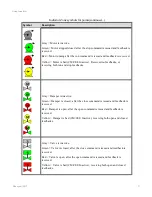
Indicator
. An indicator gives a visual indication of a value, relative to its
minimum and maximum values.
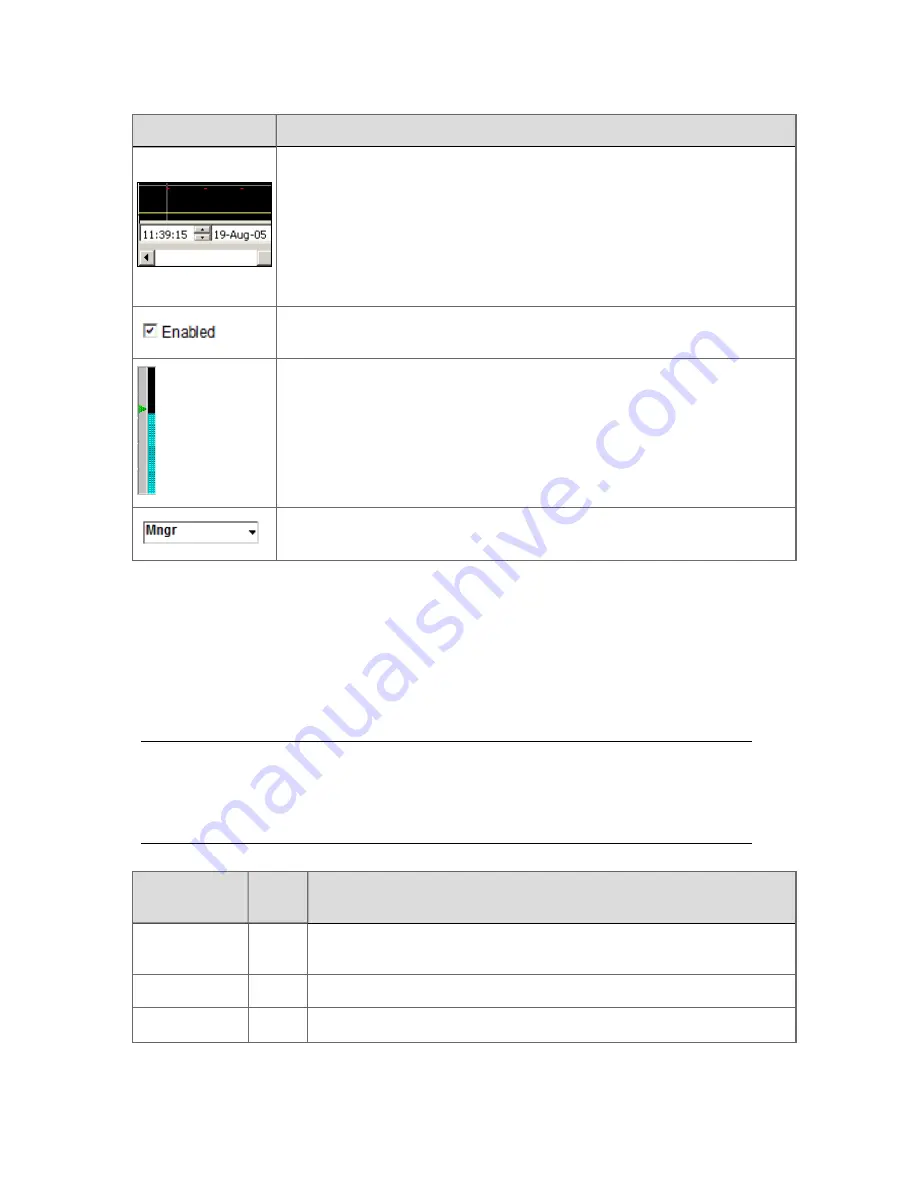
List
. Contains a list of options. You display the list by clicking the down
arrow, and then select the appropriate option by clicking it.
Abnormal alphanumeric value indication
Depending upon the configuration of your Experion system, you may at times see an
alphanumeric display object change the display color of the point value, or show other than a
point value, such as dots or an ellipsis ('...'), question marks ('???????'), asterisks ('*******'),
dashes ('-------'), or inverse video (for example, white-on-black instead of black-on-white).
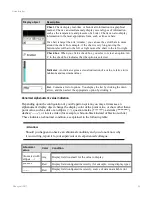
These indicate an abnormal condition, as explained in the following table:
Attention:
Should you happen to observe an abnormal condition, and you do not know why
it is occurring, report it to your supervisor or an experienced colleague.
Abnormal
value
Color
Condition
(truncated with
ellipsis …)
Any
Display field too small for the value to display.
*******
Red
Display field configured incorrectly (for example, wrong display type).
-------
Red
Display field configured incorrectly, source of data unavailable (for
Using displays
Honeywell 2017
56

