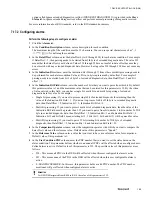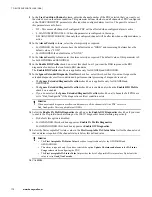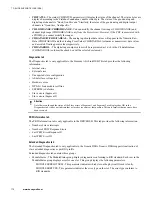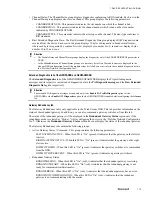
If icon is...
Then it indicates...
blue
The DSB is created but not loaded.
blue
All configuration parameters are loaded.
yellow
The DSB or at least one PDC has configuration error or slave
device indicates configuration error in diagnostics data and
slave device is communicating. PDC configuration error can be
non bound net tag, input bound to output data or vice versa or
size of net tag bound to PDC is not big enough to store data for
all channels defined in PDC.
green
The device diagnostics data indicates that slave device is
communicating and there are no configuration errors.
red
The device diagnostics data indicates that slave device is not
communicating.
red
The DSB block has detected critical internal software error that
prevents communication with device. If the DSB block enters
this state, the state does not change until the DSB is reloaded.
7.18.5 DSB block diagnostic alarms
When active, the DSB block reports the following diagnostic alarms.
Alarm
Description
Communication break with PROFIBUS slave
This is a high-priority alarm that is reported when the slave device is
not able to communicate with the master over the network. This alarm
is reported only when the PROFIBUS network is functional.
Attention
This alarm is not generated when the master has only one slave
device connected. This is because, the master cannot identify if
the network is down of if the slave device is in a fault state.
To rectify this error, you must check the slave device address and the
network cabling.
PROFIBUS slave configuration failure
This is a high-priority alarm that is reported when the slave device
configuration in the field network configuration does not match with
the slave device hardware configuration.
To rectify this error, you must check the slave device configuration in
the field network.
Connection break with PROFIBUS slave
This alarm is reported when a DSB is physically disconnected from the
PBLink or an I/O module is physically disconnected from the DSB.
Lost Connection to Slave
This alarm is reported when a device is disconnected from the
PROFIBUS network.
This alarm returns to normal when the slave device is connected back
in the network.
Module fault on Slot n
This alarm is reported when the diagnostic data indicates failure in the
module in slot "n." When this alarm is reported, the Trip Value field in
the alarm summary displays the module status reported in the extended
diagnostics.
This alarm returns to normal after fresh diagnostics are received for the
slot and the diagnostics does not indicate a module failure. For each
faulty slot, an alarm is reported.
7 DEVICE SUPPORT BLOCK (DSB)
175
Summary of Contents for Experion PKS
Page 1: ...Experion PKS PROFIBUS Gateway Module User s Guide EPDOC XX88 en 431E June 2018 Release 431 ...
Page 8: ...CONTENTS 8 www honeywell com ...
Page 10: ...1 ABOUT THIS GUIDE 10 www honeywell com ...
Page 32: ...4 PROFIBUS GATEWAY MODULE PGM INSTALLATION 32 www honeywell com ...
Page 58: ...5 PROFIBUS GATEWAY MODULE PGM BLOCK 58 www honeywell com ...
Page 69: ...6 PROTOCOL BLOCK 69 ...
Page 103: ...5 Click OK 6 PROTOCOL BLOCK 103 ...
Page 110: ...6 PROTOCOL BLOCK 110 www honeywell com ...
Page 183: ...PDC Details tab Figure 6 Detail Display of PDC Details tab 7 DEVICE SUPPORT BLOCK DSB 183 ...
Page 186: ...7 DEVICE SUPPORT BLOCK DSB 186 www honeywell com ...
Page 231: ...9 PROFIBUS I O MODULE PIOMB FUNCTION BLOCK 231 ...
Page 232: ...9 PROFIBUS I O MODULE PIOMB FUNCTION BLOCK 232 www honeywell com ...
Page 236: ...10 PROFIBUS GATEWAY MODULE PGM CONFIGURATION EXAMPLE 236 www honeywell com ...
Page 264: ...13 PROFIBUS GATEWAY MODULE PGM TROUBLESHOOTING 264 www honeywell com ...

