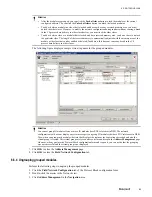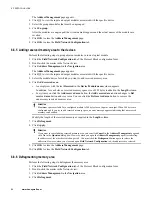
6.10.5 Protocol Block icons
The following table summarizes the various appearances that a Protocol Block icon can assume based on view
and current Protocol Blockstate.
If Icon is...
Then it indicates...
Project view
gray
Protocol Block a is associated with configured PGM.
Monitoring view
green
Protocol Block is active.
red
Protocol Block is in a failed state.
6.10.6 Protocol Block notifications
When the Protocol Block is active, it generates the following notifications.
Notification
Description
Field Network
Failure
This notification is generated when the master has lost connection to all PROFIBUS slave devices.
Field Network
Configuration
Failure
After the Protocol Block is downloaded, the CRC sum of the parameter NETCONFBIN is calculated.
It is then compared to the NETCONCRCSUM parameter which was calculated by the tools. In there
is a mismatch in this comparison, this notification is generated.
You must modify and reload the field network configuration for this notification to return to normal.
Field Network Tag
Table Failure
After the Protocol Block downloaded, the CRC sum of the parameter NETTAGTABLEBIN is
calculated. It is then compared to the value that was loaded along the NETTAGTABLEBIN parameter.
If there is a mismatch in this comparison, this notification is generated.
You must modify and reload the field network configuration for this notification to return to normal.
Input Data Base
Cycle Changed
The input data is sampled on every Process Data Access (PDA) base cycle, which is the smallest raw
data cycle seen in PDA opens. The data delivery time which is the time consumed between process
data read from the PROFIBUS network to the end of triggering PDA transport is measured on every
cycle.
The new data sample time is calculated based on the data delivery time and the start time of the earlier
sample. If the data delivery time is longer than minimum cycle (5 ms), the next sample will be
delayed so that there is always a minimum of 5 ms time from the end of data delivery to the start of
the next sample.
If the data delivery takes more than the minimum cycle (5 ms) on three consecutive cycles, this
notification is generated. This notification returns to normal when the data delivery time has been
below minimum cycle (5ms) on three consecutive cycles.
To recover from this, you must reduce either the number of PIOMB connections or the input data read
cycle defined in the PIOMB block.
6 PROTOCOL BLOCK
93
Summary of Contents for Experion PKS
Page 1: ...Experion PKS PROFIBUS Gateway Module User s Guide EPDOC XX88 en 431E June 2018 Release 431 ...
Page 8: ...CONTENTS 8 www honeywell com ...
Page 10: ...1 ABOUT THIS GUIDE 10 www honeywell com ...
Page 32: ...4 PROFIBUS GATEWAY MODULE PGM INSTALLATION 32 www honeywell com ...
Page 58: ...5 PROFIBUS GATEWAY MODULE PGM BLOCK 58 www honeywell com ...
Page 69: ...6 PROTOCOL BLOCK 69 ...
Page 103: ...5 Click OK 6 PROTOCOL BLOCK 103 ...
Page 110: ...6 PROTOCOL BLOCK 110 www honeywell com ...
Page 183: ...PDC Details tab Figure 6 Detail Display of PDC Details tab 7 DEVICE SUPPORT BLOCK DSB 183 ...
Page 186: ...7 DEVICE SUPPORT BLOCK DSB 186 www honeywell com ...
Page 231: ...9 PROFIBUS I O MODULE PIOMB FUNCTION BLOCK 231 ...
Page 232: ...9 PROFIBUS I O MODULE PIOMB FUNCTION BLOCK 232 www honeywell com ...
Page 236: ...10 PROFIBUS GATEWAY MODULE PGM CONFIGURATION EXAMPLE 236 www honeywell com ...
Page 264: ...13 PROFIBUS GATEWAY MODULE PGM TROUBLESHOOTING 264 www honeywell com ...

