13
13
SEA LEVEL
barometric pressure option
should be selected. In this case, the
SEA LEVEL
barometric pressure value can be adjusted according to the local
metro area weather information. (Sources – local TV or radio station, etc).
NOTE
: Locate your altitude with a portable GPS receiver or topographical
map .Locate barometric pressure at: http://weather.noaa.gov/weather/ccus.html
or, alternatively, from local radio or TV weather channels.
Once the main unit is powered, the display will show all available LCD
segments for a moment
IMPORTANT
: All of the display functions will be locked, allowing setting
pressure parameters and your local altitude. The locked display will show the
abbreviation
“hPa/mBar”
flashing in the
Pressure Mode
, indoor temperature
and humidity readings in
Temperature/Humidity Mode
, default time in
Clock
Mode
and a default date in the
Alarm/Calendar Mode
.
If the pressure and altitude are not configured during this time, the unit will
self-calibrate in a few minutes and show the default settings for the pressure
and altitude (sea level) and the remote sensor reading.
NOTE
:
This is the only time when you can enter/adjust your local altitude
units and value.
To set the pressure & altitude units and program your altitude, use the main unit
buttons located on the back:
•
Press
UP
or
DOWN
button on the back of the unit selecting the
pressure in
inHg
or
hPa/mBar
•
Press
UNIT
button to confirm and move to the altitude unit selection
mode
•
Press
UP
or
DOWN
button selecting the altitude unit in feet or meters.
•
Press
UNIT
button to confirm and move to the altitude value
programming mode.
14
•
Press
UP
or
DOWN
to adjust an altitude value. Press and hold either
button for the advanced setting.
•
Press
PRESSURE/ALTITUDE
button
to confirm the programmed
altitude.
Unit will show dashes “- - - “instead of local barometric pressure for a moment
and then will self-adjust to the new altitude
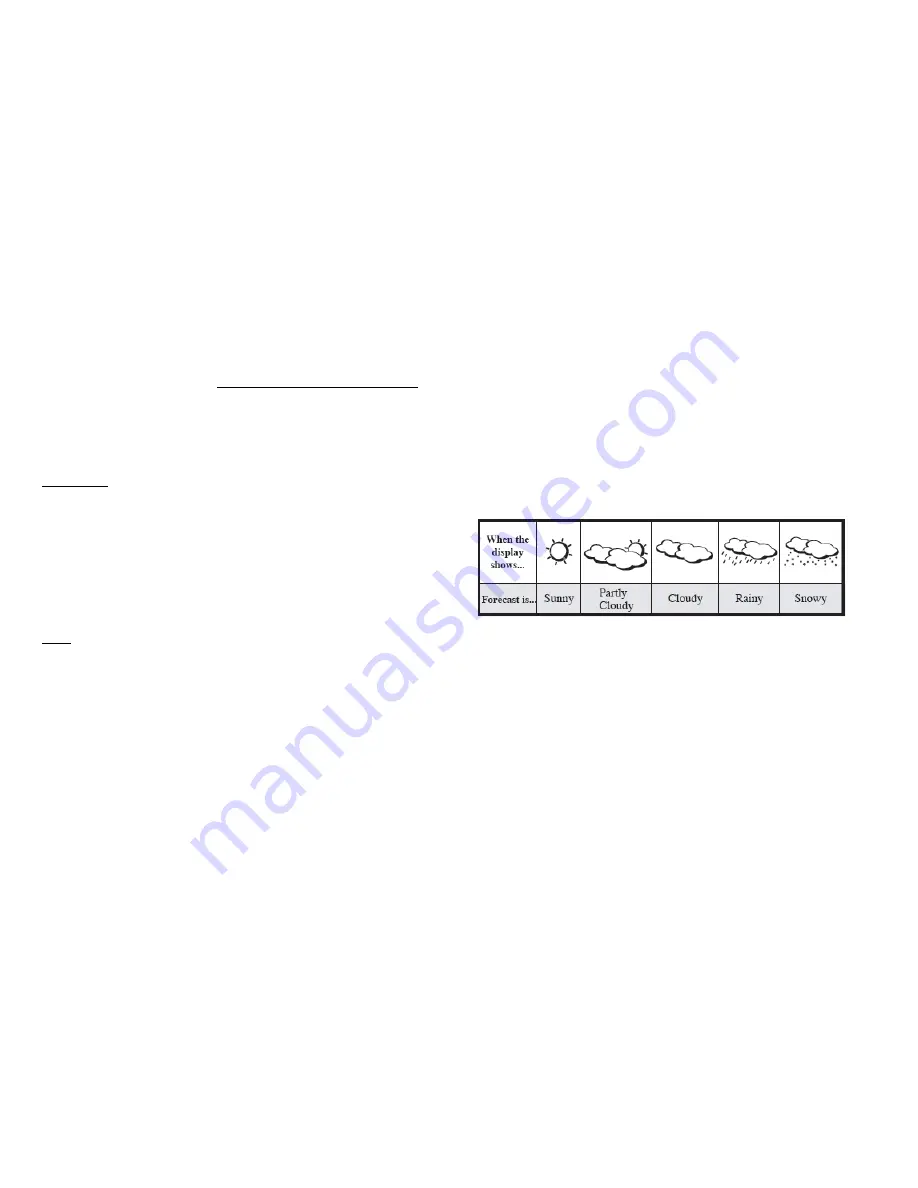
WEATHER FORECAST
This unit is capable of detecting the atmospheric pressure changes. Based on
collected weather data, it forecasts the weather for the next 12 to 24 hours.
Note: The weather forecast accuracy is approximately 70%.
Display shows forecasted, not current conditions. The SUNNY icon
indicates clear weather, even when displayed during the night-time
PRESSURE HISTORY CHART
The pressure bar graph shows barometric pressure variations over the past 24
hours. This is very useful for understanding the Barometric trends that are used
in weather forecasting. Each bar icon represents 0.06 inHg or 2mBar

