Piecewise defined functions
It is possible to graph piecewise defined functions using the Function aplet, although it involves literally
splitting the function into pieces.
⎧
x
+
3
;
x
< −
2
⎪
For example:
f x
( )
= ⎨
x
2
−
2
;
−
2
≤
x
≤
1
⎪
3
−
x
;
x
≥
1
⎩
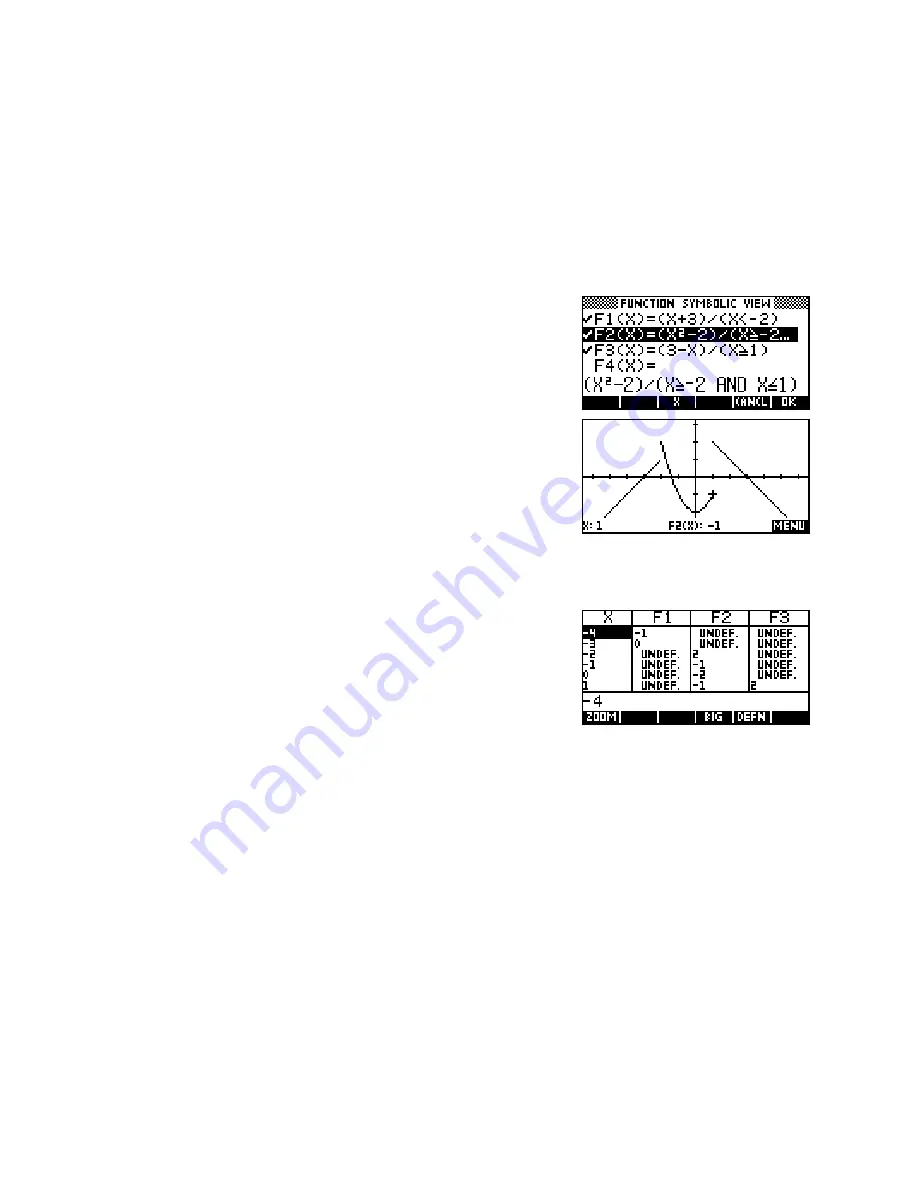
To graph this we need to enter it into the
SYMB
view as
three separate functions:
F1(X)=(X+3)/(X
<
-2)
F2(X)=(X2-2)/(X
≥
-2 AND X
≤
1)
F3(X)=(3-X)/(X
≥
1)
Note: The
AND
function can be found on top of the
(-)
key
.
-2 AND X
≤
The reason why this works is that the
(X
<
-2)
and the
(X
≥
1)
expressions are evaluated as being
either true (which for computers has a value of 1) or false (which has a value of 0).
By dividing by this domain expression we are effectively dividing by 1
inside the range (with no effect) or dividing by zero outside the domain
(making the function undefined). This can be seen in the
NUM
view to
the right. Since undefined values are not graphed, this produces the
desired effect.
77


