22.
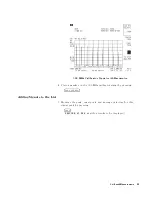
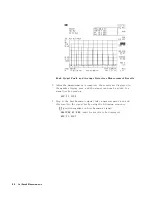
T
o
show
a
logarithmic
graphical
representation
of
the
signals
in
the
signal
list,
press:
NNNNNNNNNNNNNNNNNNNNNNNNNNNNNNNNNNNNNNNNNNNN
SAVE
LOG
GRAPH
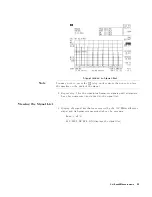
Signals
Plotted
on
Log
Frequency
Scale
Saving
Signal
Lists
Graphs
Note
Signal
list
graphs
can
only
be
saved
to
a
disk.
23.
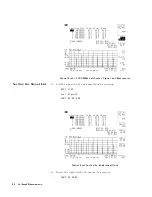
T
o
save
the
displayed
log
signal
list
graph
to
a
oppy
disk:
Enter
the
register
number
8
and
press
4
ENTER
5
The
saving
process
takes
several
minutes
.
The
le
on
disk
is
a
Windows
bitmap
(.BMP)
accepted
by
most
Windows
applications
which
read
graphic
images
.
Note
The
\Register
# "
message
is
not
saved
to
the
.BMP
le
.
4-12
List-Based
Measurements

