HP
85640A
RF
Tracking
Generator
Circuit
Descriptions
and
Troubleshooting
Procedures
The
HP
85640A
RF
tracking
generator
is
designed
for
operation
with:
HP
8560A/E
spectrum
analyzers
(non-Option
002)
HP
8561A/B/E
spectrum
analyzers
HP
8562A/B
spectrum
analyzers
HP
8563A/E
spectrum
analyzers
These
instruments
,
referred
to
as
\host"
spectrum
analyzers
,
may
have
a
much
wider
frequency
range
than
the
tracking
generator's
range
of
300
kHz
to
2.9
GHz.
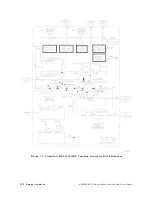
The
simplied
block
diagram
of
a
spectrum
analyzer/tracking
generator
system,
Figure
7-8,
shows
only
the
host
spectrum
analyzer's
low
band
(<2.9
GHz).
The
tracking
generator
accepts
two
RF
signals
from
the
host
spectrum
analyzer
(1ST
LO
OUTPUT
and
CAL
OUTPUT),
and
two
control
signals
(0.5V/GHz
OUTPUT
and
BLANKING
OUTPUT).
Although
Figure
7-8
does
not
show
these
two
control
signals
,
they
appear
as
0.5V/GHz
INPUT
and
BLANKING
INPUT
in
Figure
7-9.
Their
operation
is
explained
in
\HP
85640A
Block
Diagram
Circuit
Descriptions
,"
below
.
The
tracking
generator
amplies
the
300
MHz
CAL
OUTPUT
signal
from
the
host
spectrum
analyzer
and
doubles
it
to
600
MHz.
The
91.07
MHz
tracking
oscillator
(V
CXO)
output
is
doubled
to
182.14
MHz,
then
mixed
with
the
600
MHz
signal.
The
sum
of
these
two
signals
,
782.14
MHz,
is
multiplied
by
ve
to
generate
3.9107
GHz.
Notice
that
3.9107
GHz
is
the
same
frequency
as
the
host
spectrum
analyzer's
rst
IF
.
The
3.9107
GHz
signal
is
applied
to
a
modulator
,
which
levels
the
output
and
provides
ne
adjustment
of
the
output
power
level
(using
the
OUTPUT
LEVEL
vernier).
The
modulator
output
is
mixed
with
the
1st
LO
signal
from
the
host
spectrum
analyzer
and
amplied.
Since
the
host
spectrum
analyzer's
1st
LO
is
always
greater
than
the
tuned
frequency
by
3.9107
GHz
(the
1st
IF),
and
the
tracking
generator
mixes
this
1st
LO
signal
with
3.9107
GHz,
the
tracking
generator
output
frequency
will
be
the
same
as
the
host
spectrum
analyzer's
tuned
frequency
.
The
spectrum
analyzer's
1st
IF
does
not
need
to
be
exactly
3.9107
GHz,
as
long
as
the
tracking
generator's
1st
IF
is
equal
to
the
1st
IF
of
the
host
spectrum
analyzer
.
Use
the
TRA
CKING
ADJUST
control
to
set
the
tracking
generator's
1st
IF
equal
to
the
analyzer's
1st
IF
.
The
output
power
of
the
HP
85640A
RF
tracking
generator
can
be
adjusted
in
10
dB
steps
using
the
70
dB
step
attenuator
.
HP
85640A
Block
Diagram
Circuit
Descriptions
A
block
diagram
of
the
HP
85640A
RF
tracking
generator
is
shown
in
Figure
7-9.
Most
of
the
RF
circuitry
is
contained
in
the
A2
tracking
generator
assembly
.
The
A3
interface
assembly
provides
the
control
signals
for
the
A2
tracking
generator
assembly
.
A3
also
monitors
A2's
ALC
loop
(ALC
MON)
for
unleveled
conditions
,
and
multiplies
the
300
MHz
CAL
OUTPUT
signal
from
the
host
spectrum
analyzer
to
600
MHz
for
use
by
A2.
The
A1
Attenuator
includes
a
dc
blocking
capacitor
on
its
output
to
prevent
damage
due
to
reverse
input
voltages
in
less
than
630
V
dc
.
The
0.5V/GHz
INPUT
is
routed
to
the
power
level
control
circuitry
(refer
to
Figure
7-9)
on
the
A3
interface
assembly
.
This
signal
is
used
for
atness
compensation.
As
the
tuned
frequency
increases
,
the
0.5V/GHz
INPUT
voltage
also
increases
,
causing
A2
tracking
generator's
output
power
level
to
increase
.
This
helps
compensate
for
increased
power
losses
at
higher
frequencies
.
The
unlevel
detector
circuitry
on
A3
monitors
the
ALC
MON
line
from
the
A2
tracking
generator
.
It
lights
the
UNLEVELED
LED
on
the
instrument's
front
panel
when
an
unleveled
7-18
Service
Information
HP
85640A
RF
T
racking
Generator
Operation
and
Service
Manual
Summary of Contents for 85640A
Page 2: ...HP 85640A RF Tracking Generator Operation and Service Manual ABCDE Printed in USA ...
Page 111: ......
Page 169: ......


